Visualizing model fit
Introduction to Regression in R

Richie Cotton
Data Evangelist at DataCamp
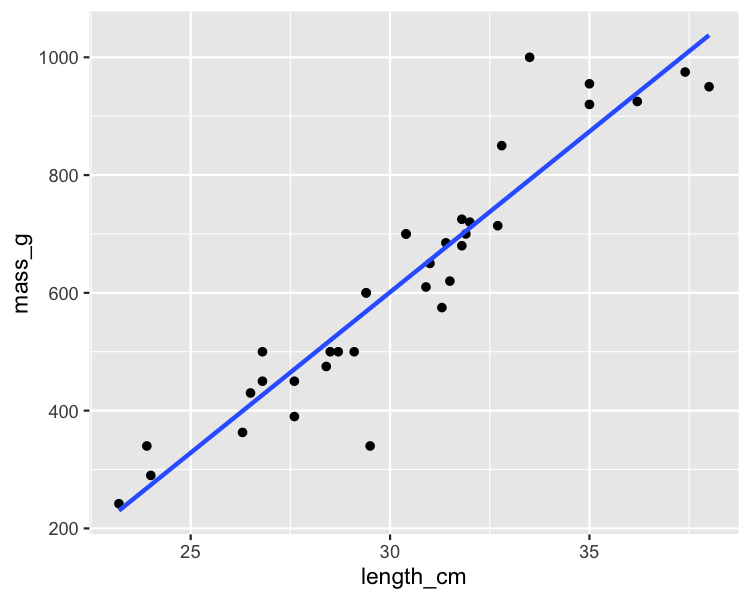
Bream and perch again
Bream: the "good" model
mdl_bream <- lm(mass_g ~ length_cm, data = bream)
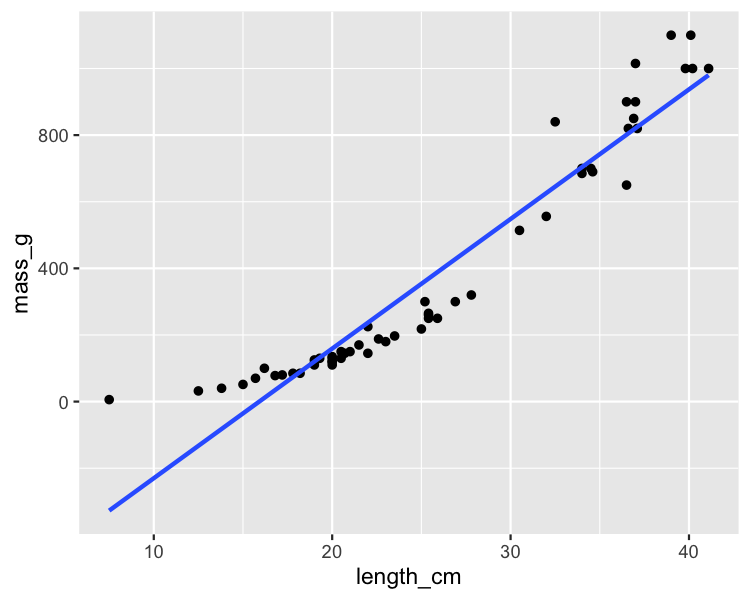
Perch: the "bad" model
mdl_perch <- lm(mass_g ~ length_cm, data = perch)
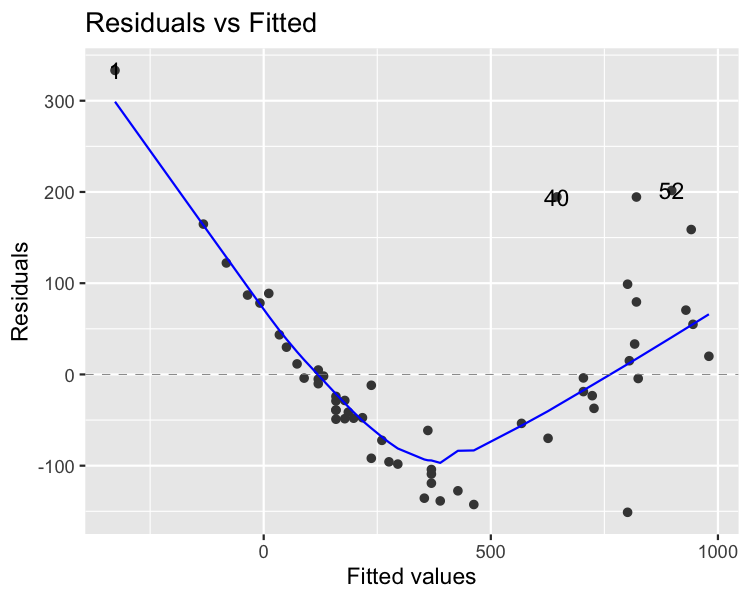
Residuals vs. fitted values
Bream

Perch
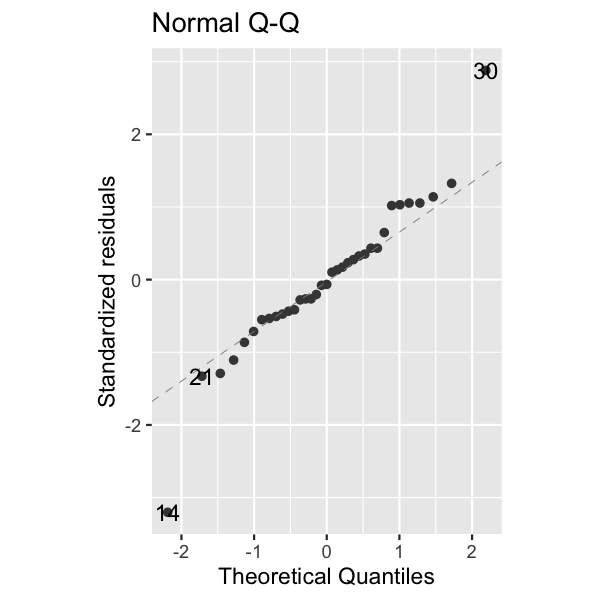
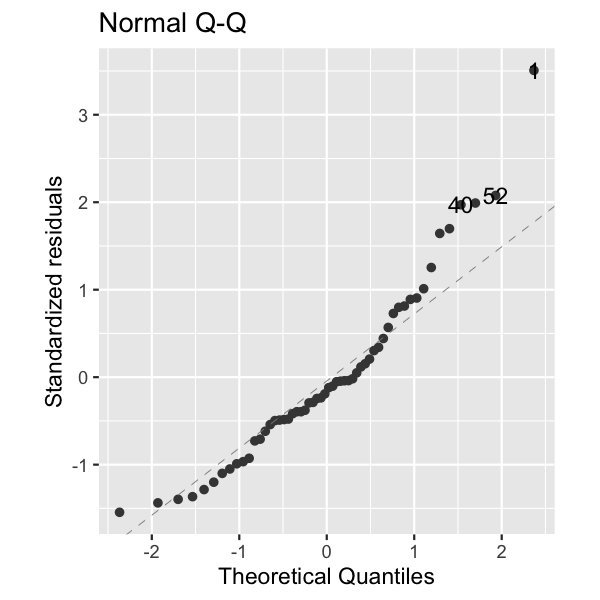
Q-Q plot
Bream
Perch
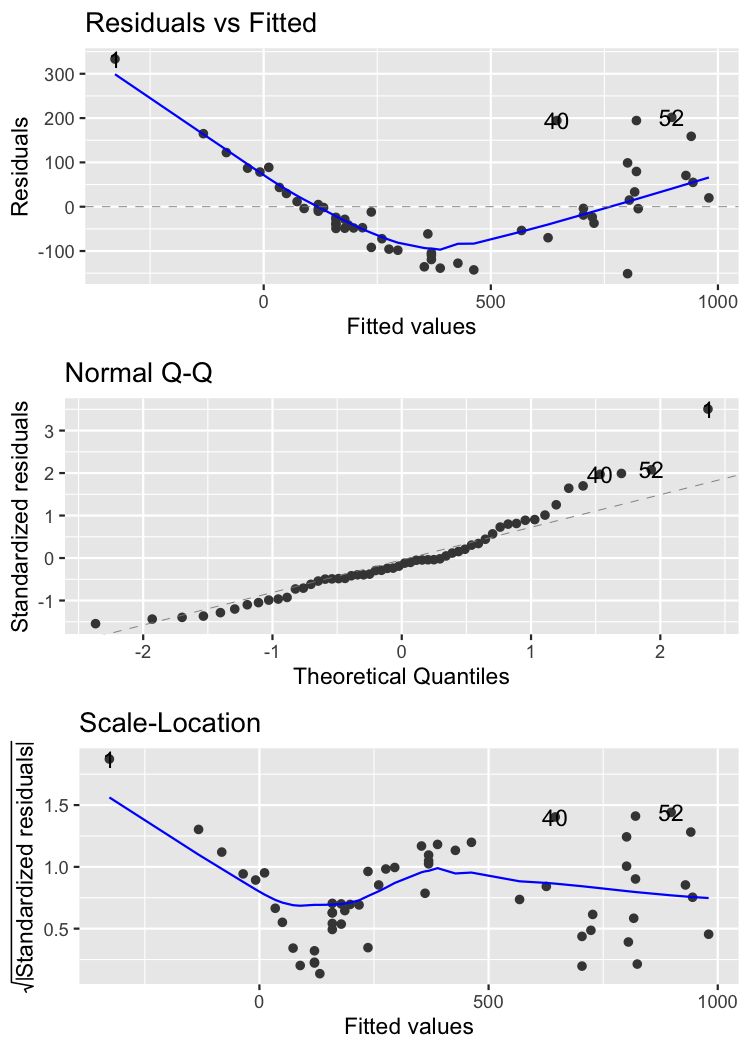
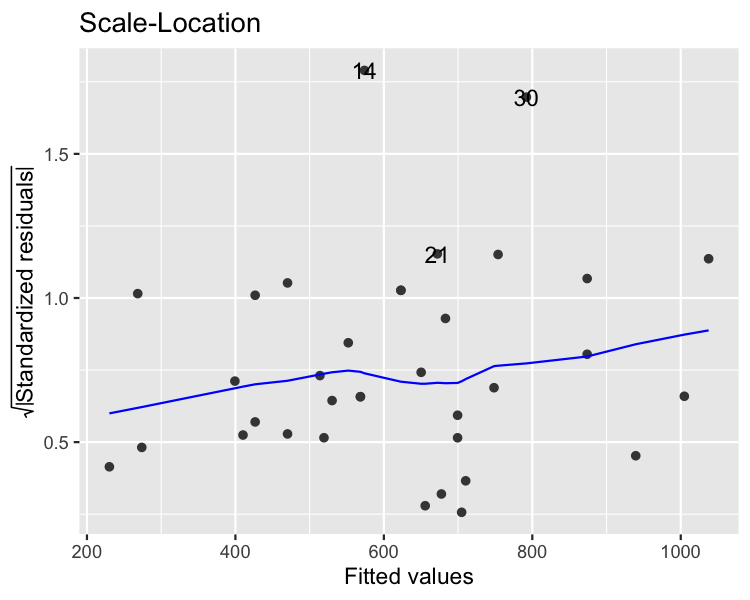
Scale-location
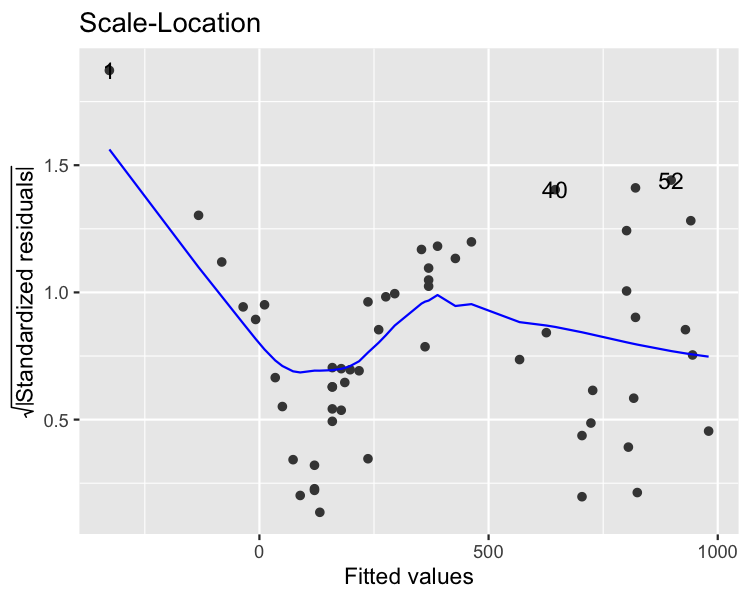
autoplot() with the perch model