Parallel slopes linear regression

Intermediate Regression in R

Richie Cotton

Data Evangelist at DataCamp

The previous course

This course assumes knowledge from Introduction to Regression in R.

Intermediate Regression in R

From simple regression to multiple regression

Multiple regression is a regression model with more than one explanatory variable.

More explanatory variables can give more insight and better predictions.

Intermediate Regression in R

The course contents

Chapter 1

  • "Parallel slopes" regression

Chapter 2

  • Interactions
  • Simpson's Paradox

Chapter 3

  • More explanatory variables
  • How linear regression works

Chapter 4

  • Multiple logistic regression
  • The logistic distribution
  • How logistic regression works
Intermediate Regression in R

The fish dataset

mass_g length_cm species
242.0 23.2 Bream
5.9 7.5 Perch
200.0 30.0 Pike
40.0 12.9 Roach
  • Each row represents a fish
  • mass_g is the response variable
  • 1 numeric, 1 categorical explanatory variable
Intermediate Regression in R

One explanatory variable at a time

mdl_mass_vs_length <- lm(mass_g ~ length_cm, data = fish)
Call:
lm(formula = mass_g ~ length_cm, data = fish)

Coefficients:
(Intercept)    length_cm  
     -536.2         34.9
  • 1 intercept coefficient
  • 1 slope coefficient
mdl_mass_vs_species <- lm(mass_g ~ species + 0, data = fish)
Call:
lm(formula = mass_g ~ species + 0, data = fish)

Coefficients:
speciesBream  speciesPerch   speciesPike  speciesRoach  
       617.8         382.2         718.7         152.0
  • 1 intercept coefficient for each category
Intermediate Regression in R

Both variables at same time

mdl_mass_vs_both <- lm(mass_g ~ length_cm + species + 0, data = fish)
Call:
lm(formula = mass_g ~ length_cm + species + 0, data = fish)

Coefficients:
   length_cm  speciesBream  speciesPerch   speciesPike  speciesRoach  
       42.57       -672.24       -713.29      -1089.46       -726.78 
  • 1 slope coefficient
  • 1 intercept coefficient for each category
Intermediate Regression in R

Comparing coefficients

coefficients(mdl_mass_vs_length)
(Intercept)   length_cm 
     -536.2        34.9
coefficients(mdl_mass_vs_species)
speciesBream speciesPerch  speciesPike speciesRoach 
       617.8        382.2        718.7        152.0
coefficients(mdl_mass_vs_both)
length_cm speciesBream speciesPerch  speciesPike speciesRoach 
    42.57      -672.24      -713.29     -1089.46      -726.78 
Intermediate Regression in R

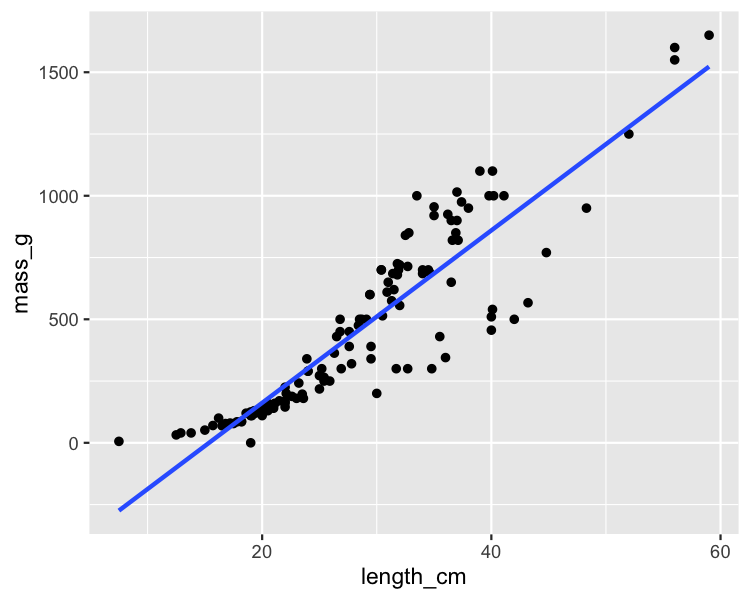
Visualization: 1 numeric explanatory var

library(ggplot2)

ggplot(fish, aes(length_cm, mass_g)) +
  geom_point() +
  geom_smooth(method = "lm", se = FALSE)

scatter-fish-mass-vs-length.png

Intermediate Regression in R

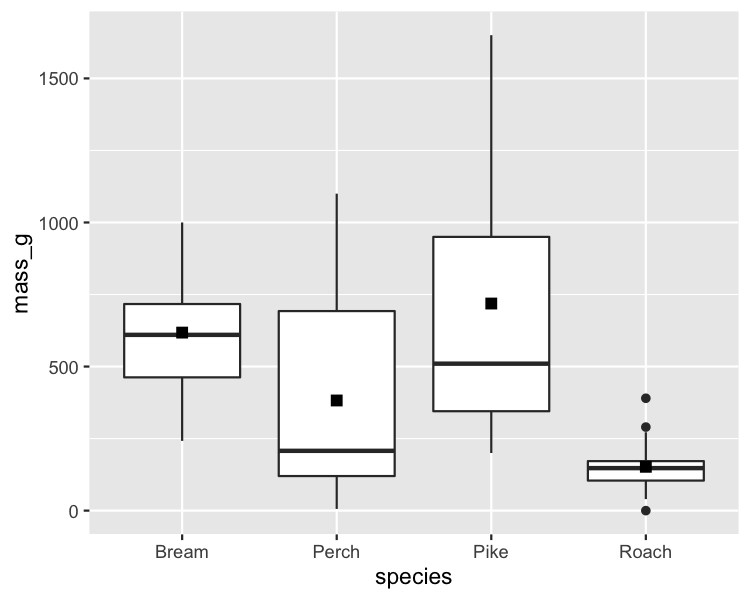
Visualization: 1 categorical explanatory var

ggplot(fish, aes(species, mass_g)) +
  geom_boxplot() + 
  stat_summary(fun.y = mean, shape = 15)

scatter-fish-mass-vs-species.png

Intermediate Regression in R

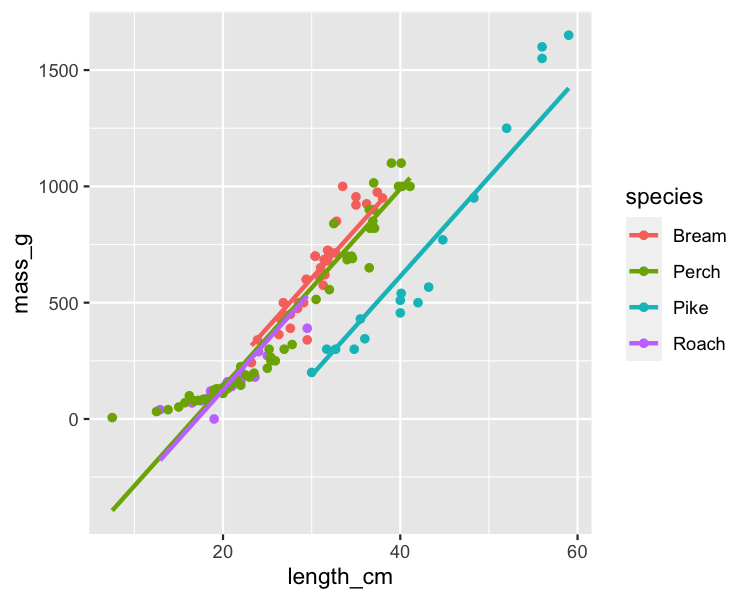
Visualization: both explanatory vars

library(moderndive)

ggplot(fish, aes(length_cm, mass_g, color = species)) +
  geom_point() +
  geom_parallel_slopes(se = FALSE)

scatter-fish-mass-vs-both.png

Intermediate Regression in R

Let's practice!

Intermediate Regression in R

Preparing Video For Download...