How linear regression works
Intermediate Regression in R

Richie Cotton
Data Evangelist at DataCamp
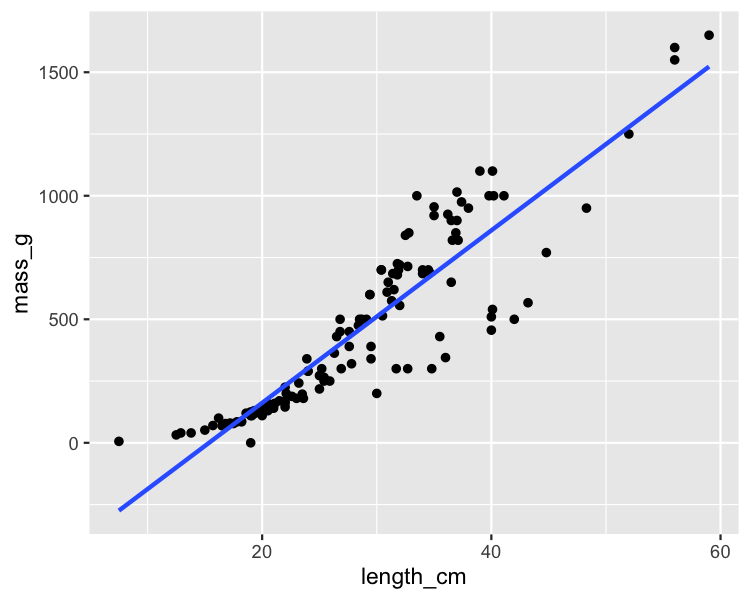
The standard simple linear regression plot
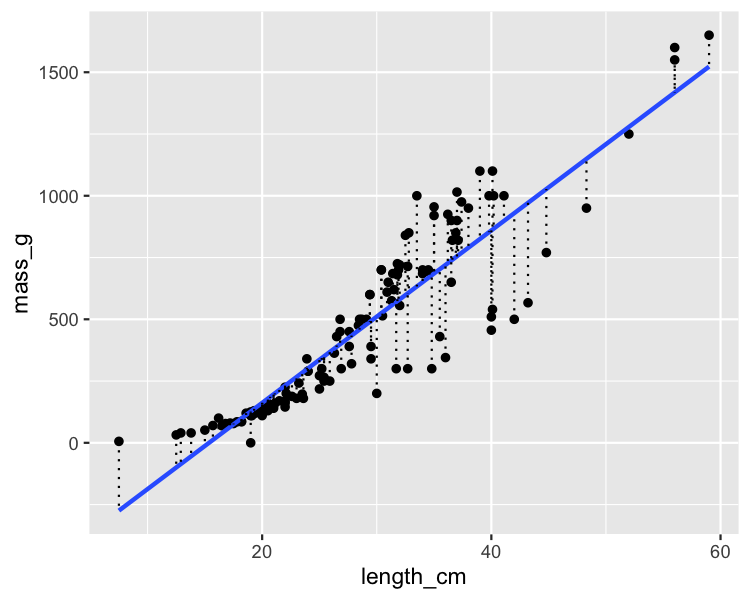
Visualizing residuals
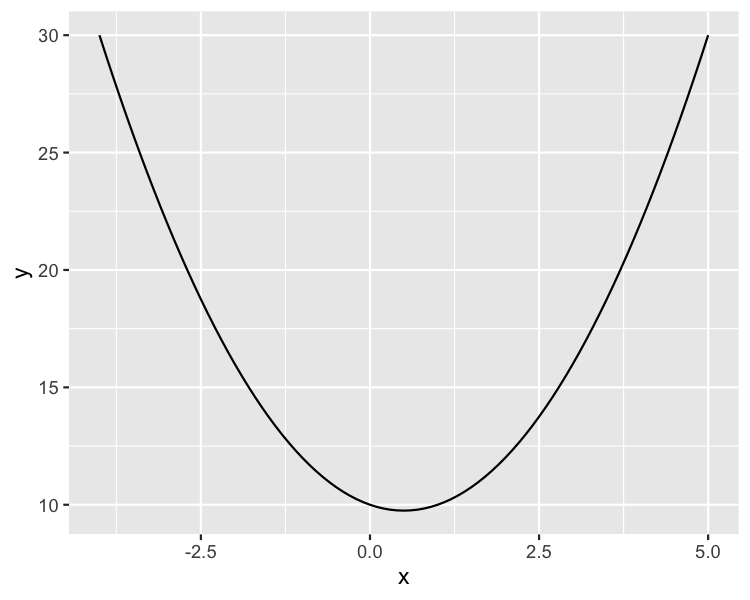
A detour into numerical optimization
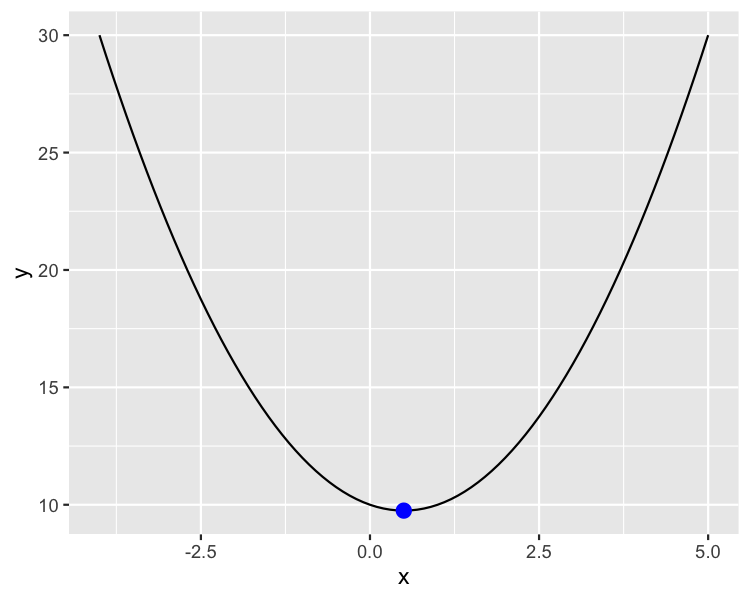
Using calculus to solve the equation
Intermediate Regression in R
Richie Cotton
Data Evangelist at DataCamp

