Introduction to bootstrapping
Sampling in R

Richie Cotton
Data Evangelist at DataCamp
With or without
Sampling without replacement

Sampling with replacement ("resampling")

Simple random sampling without replacement
Population

Sample

Simple random sampling with replacement
Population
Sample

Bootstrapping

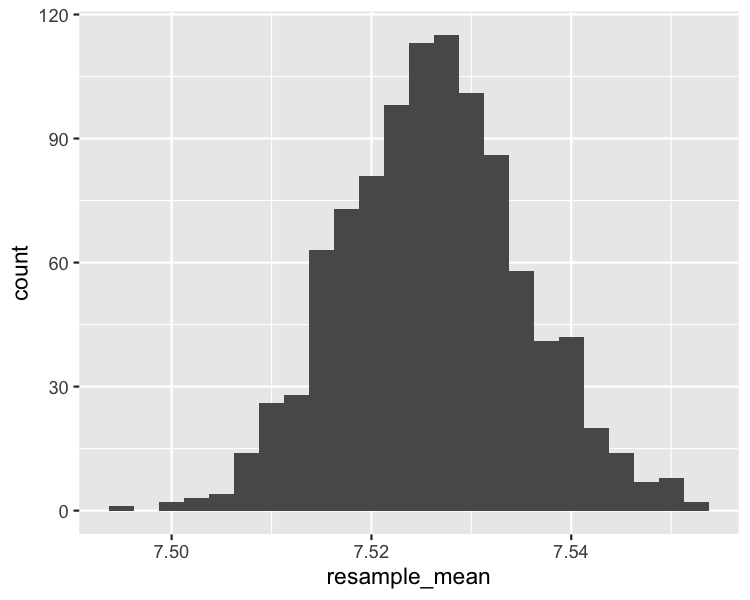
Bootstrap distribution histogram