Convenience sampling
Sampling in R

Richie Cotton
Data Evangelist at DataCamp
The Literary Digest election prediction
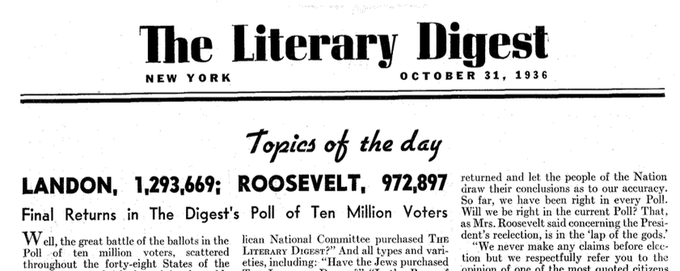
- Prediction: Landon gets 57%; Roosevelt gets 43%
- Actual results: Landon got 38%; Roosevelt got 62%
- Sample not representative of population, causing sample bias.
- Collecting data by the easiest method is called convenience sampling.
Finding the mean age of French people

1 Image by Sean MacEntee
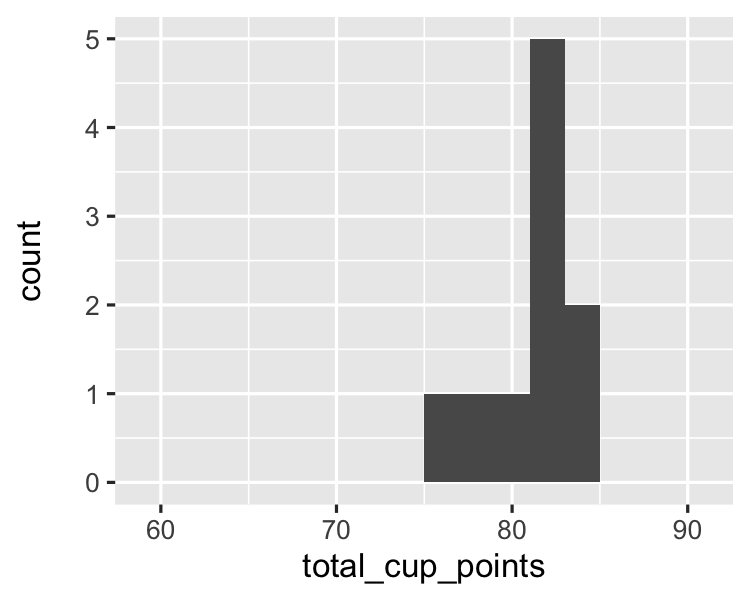
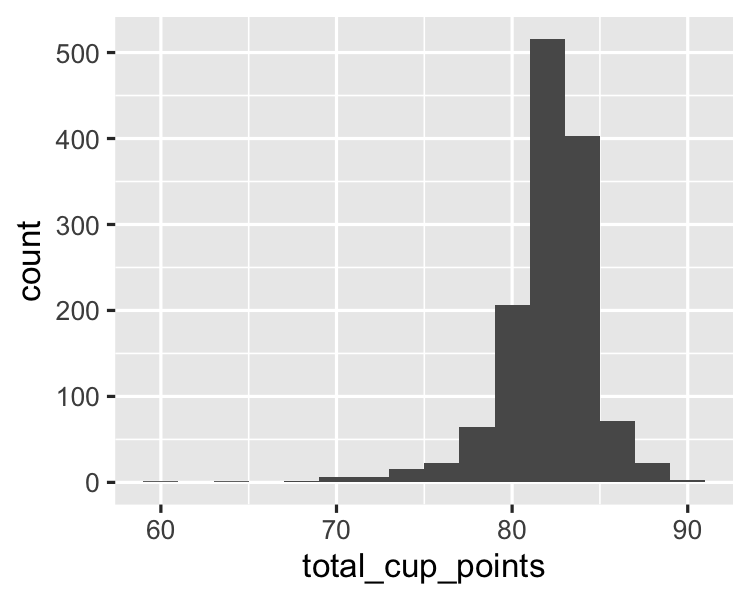
Visualizing selection bias
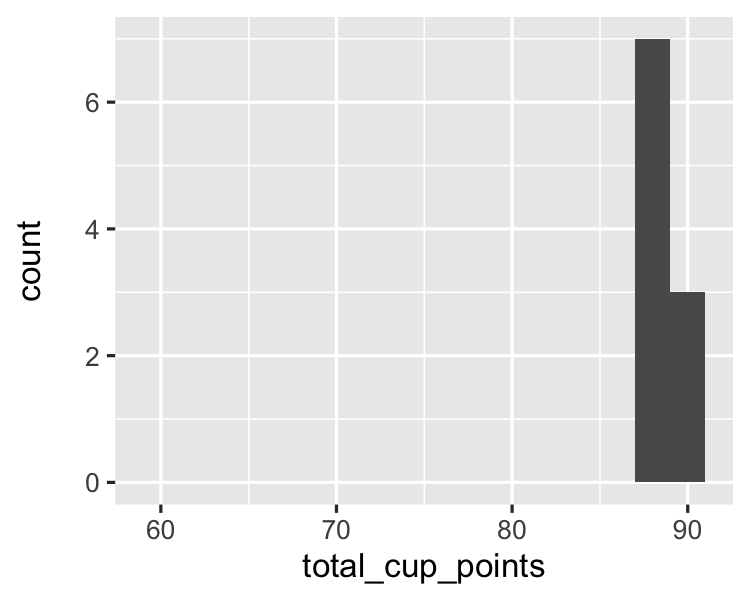
Visualizing selection bias 2