Approximate sampling distributions
Sampling in R

Richie Cotton
Data Evangelist at DataCamp
4 dice

library(tidyr)
dice <- expand_grid(
  die1 = 1:6,
  die2 = 1:6,
  die3 = 1:6,
  die4 = 1:6
)
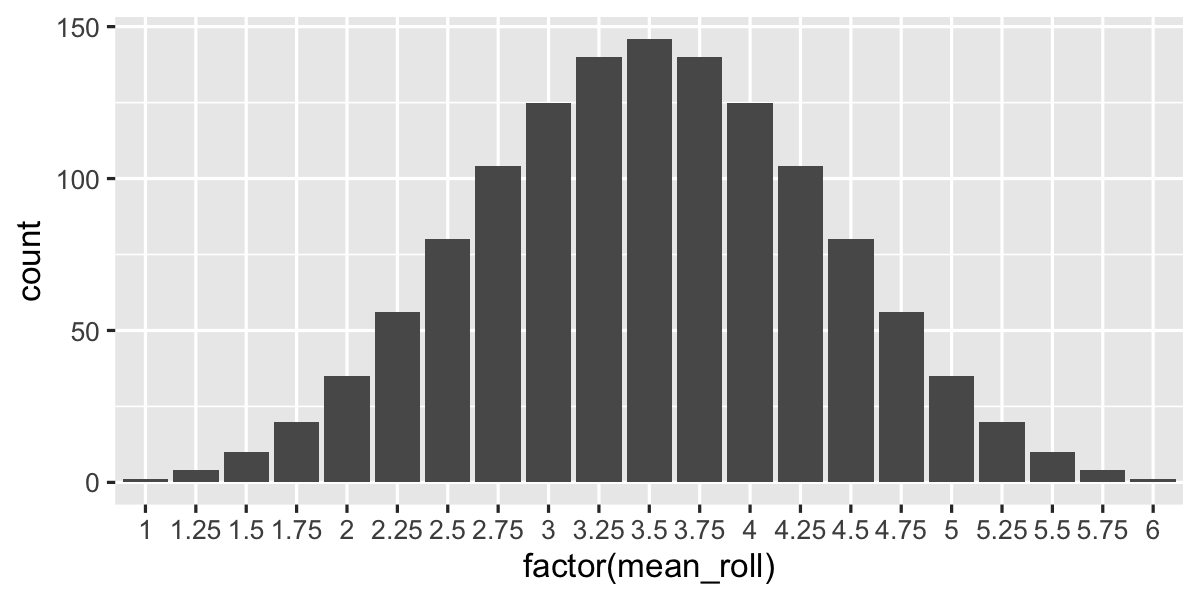
Exact sampling distribution
ggplot(dice, aes(factor(mean_roll))) +
  geom_bar()
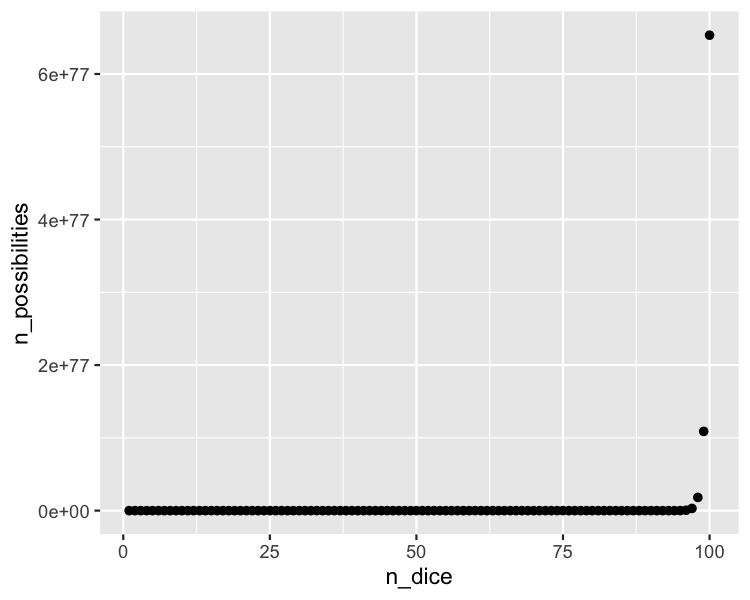
The number of outcomes increases fast
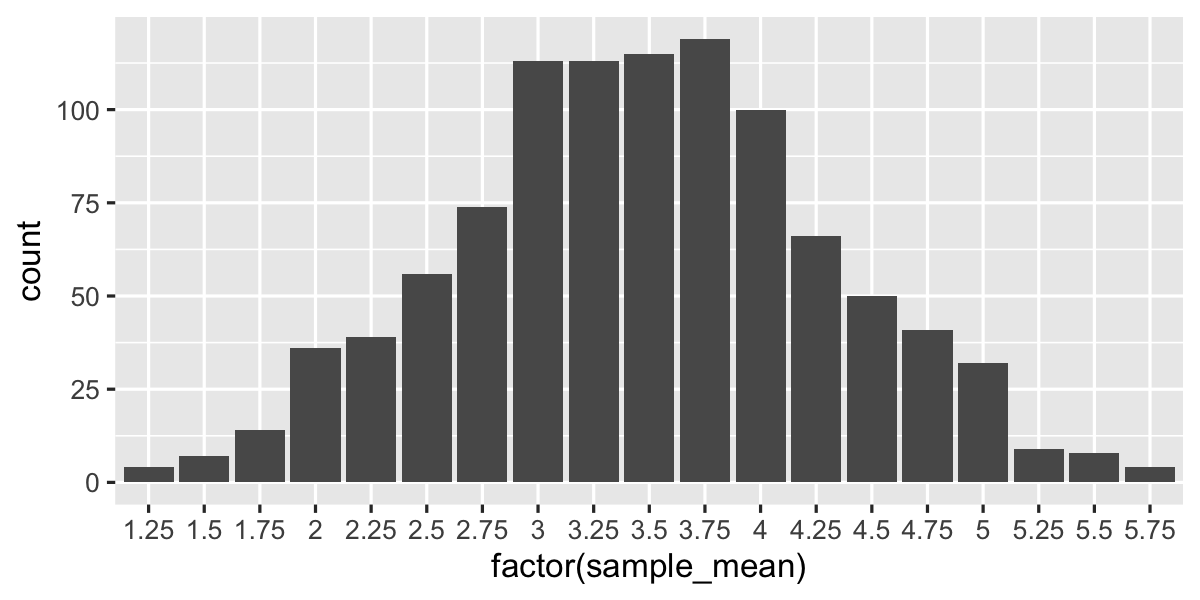
Approximate sampling distribution
ggplot(sample_means, aes(factor(sample_mean))) +
  geom_bar()