Simple random and systematic sampling
Sampling in R

Richie Cotton
Data Evangelist at DataCamp
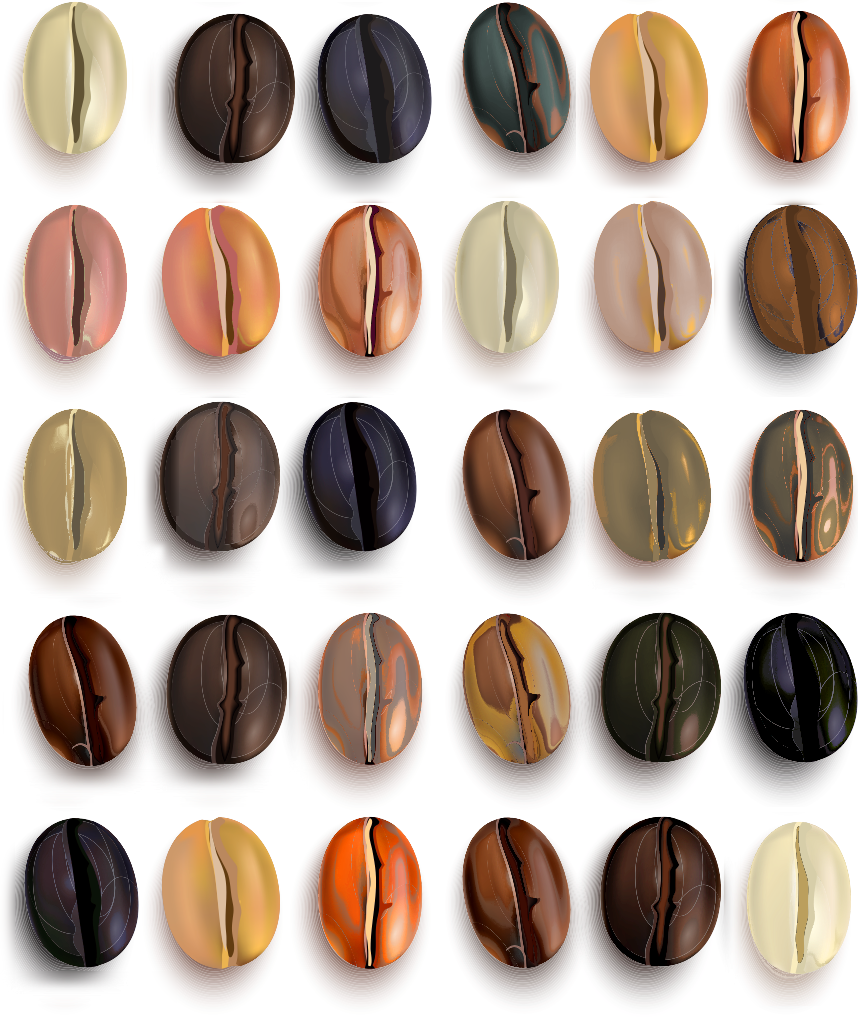
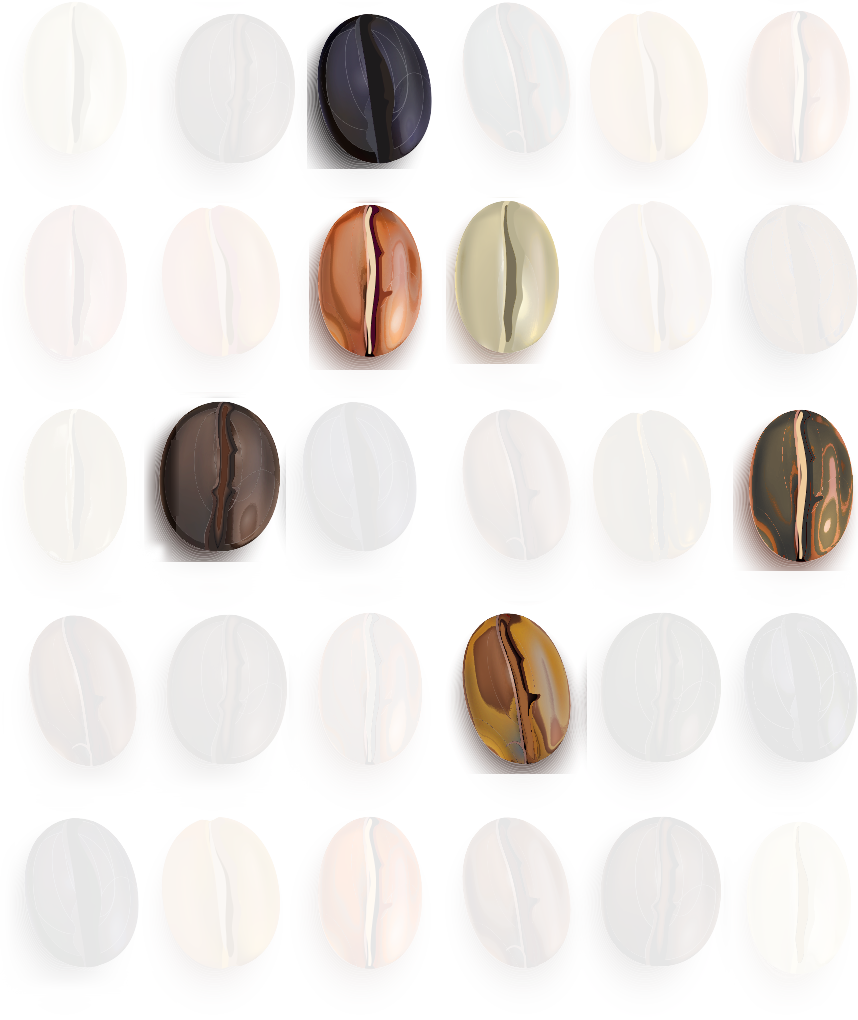
Simple random sampling


Simple random sampling of coffees
Systematic sampling
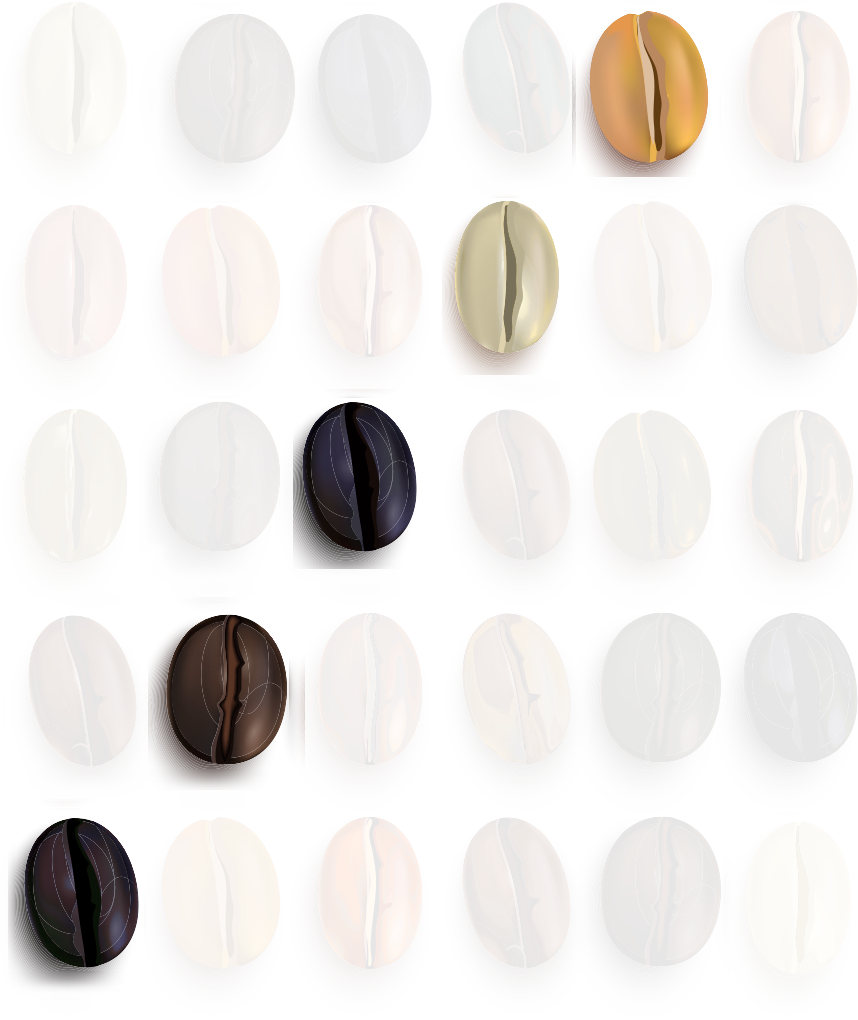
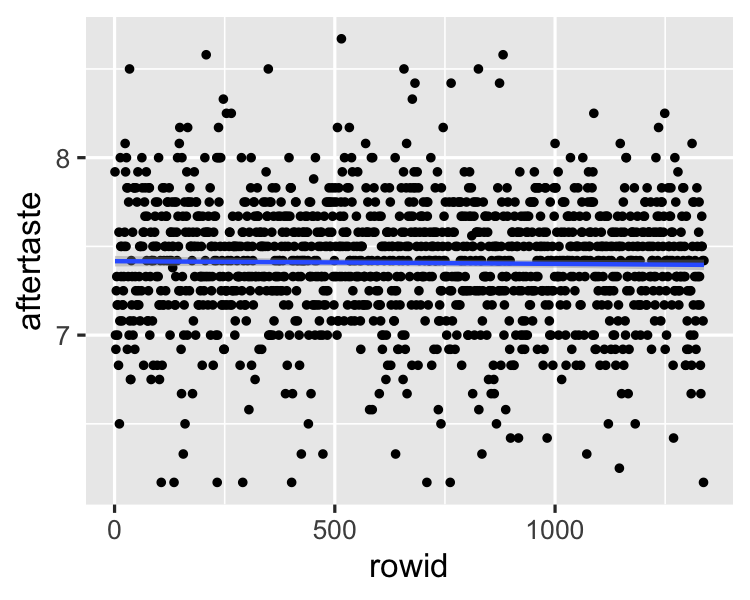
The trouble with systematic sampling
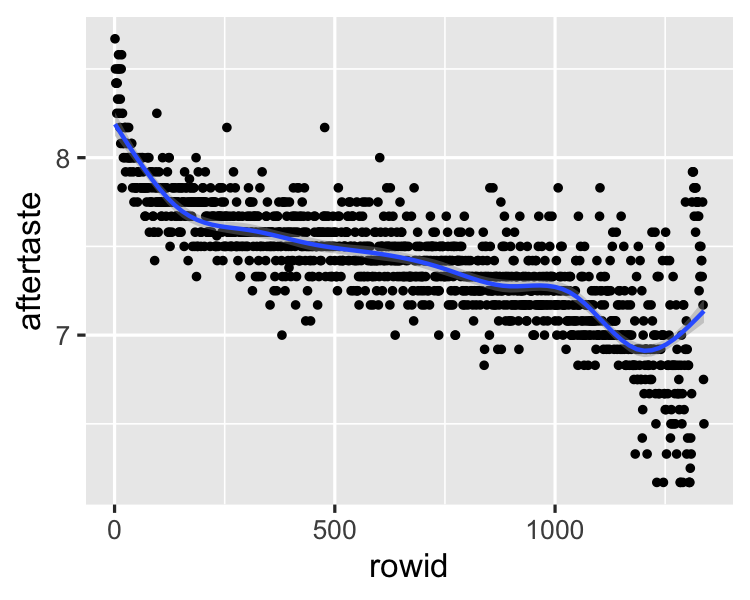
Making systematic sampling safe
Sampling in R
Richie Cotton
Data Evangelist at DataCamp

