Sampling in R
Richie Cotton
Data Evangelist at DataCamp
A census asks every household how many people live there.
Censuses are really expensive!
It's cheaper to ask a small number of households and use statistics to make estimates about the whole population.
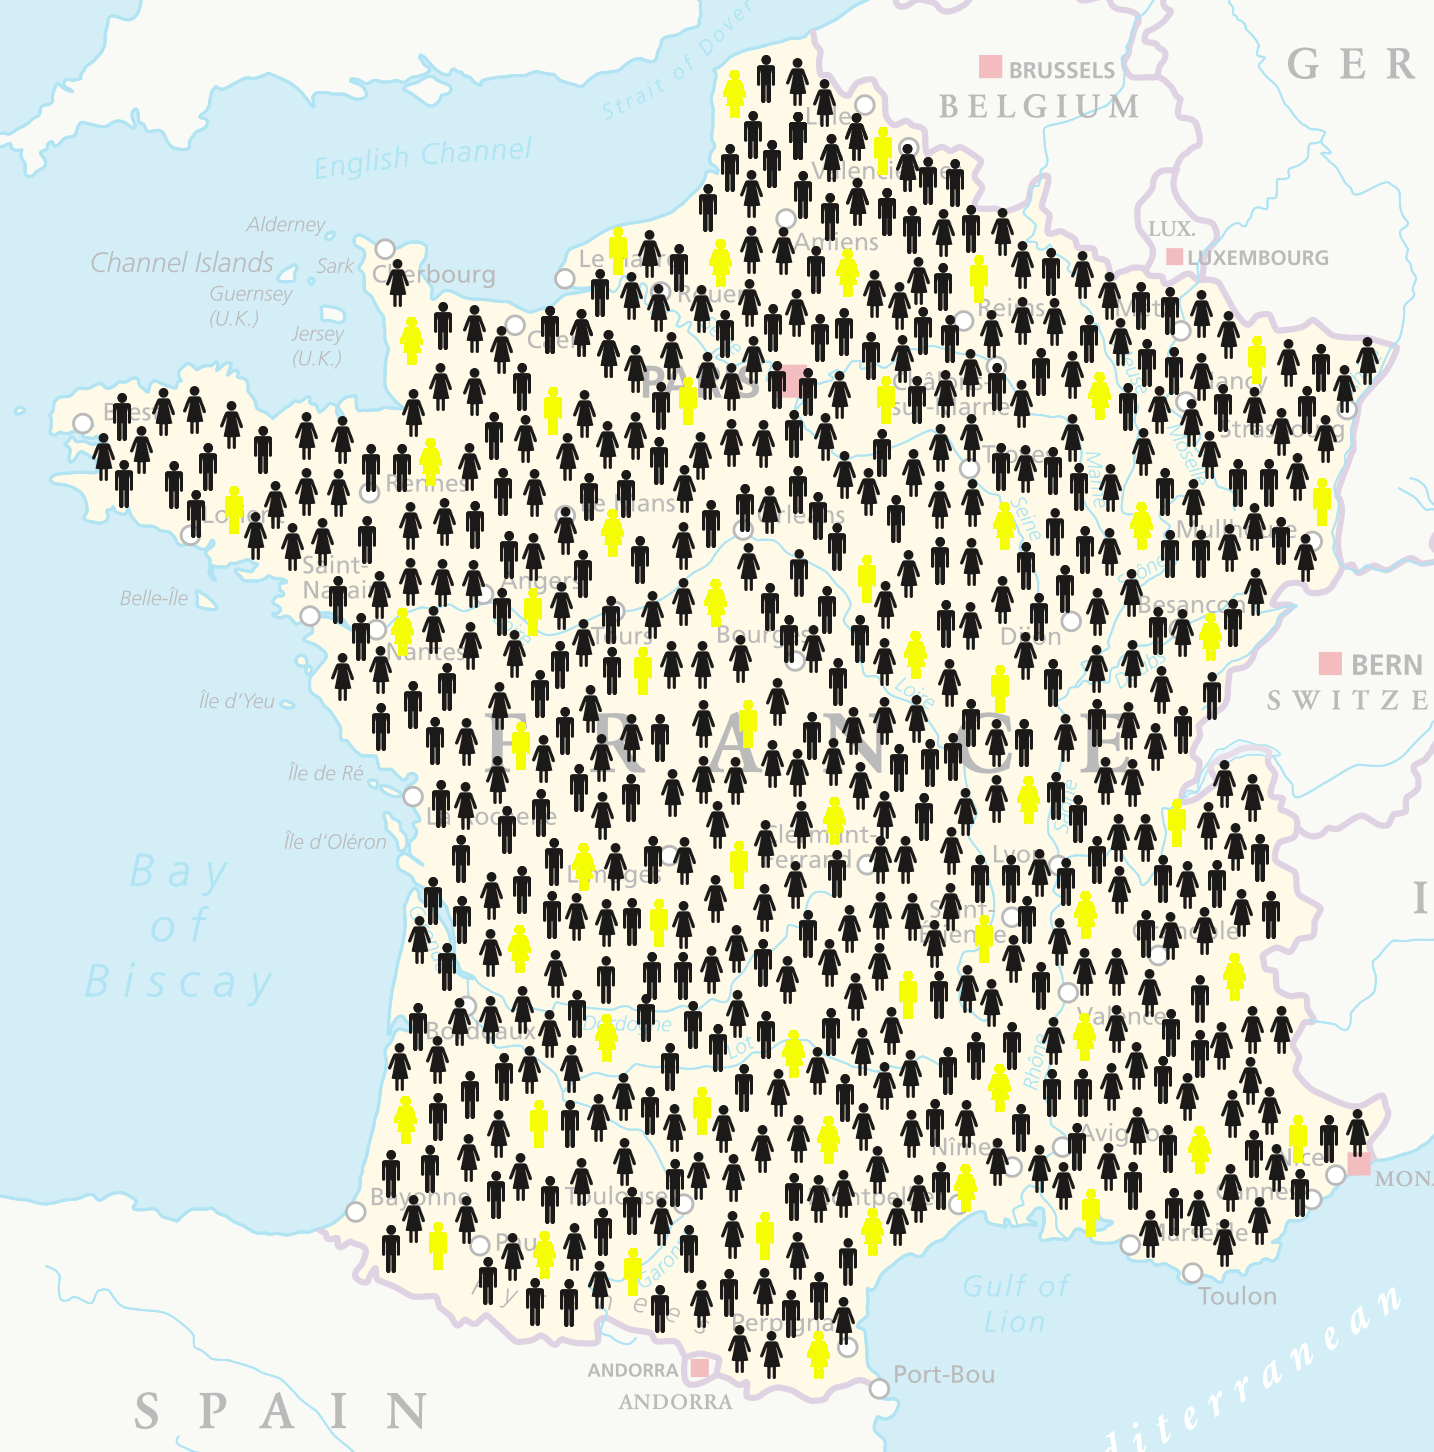
Working with a subset of the whole population is called sampling.
The population is the complete dataset.
The sample is the subset of data you calculate on.
pts_vs_flavor_pop <- coffee_ratings %>%
  select(total_cup_points, flavor)
dim(pts_vs_flavor_pop)
1338 2
     total_cup_points flavor
1               90.58   8.83
2               89.92   8.67
3               89.75   8.50
4               89.00   8.58
...              ...     ...
1335            78.08   7.67
1336            77.17   7.33
1337            75.08   6.83
1338            73.75   6.67
pts_vs_flavor_samp <- coffee_ratings %>%
  select(total_cup_points, flavor) %>%
  slice_sample(n = 10)
dim(pts_vs_flavor_samp)
10 2
   total_cup_points flavor
1             82.25   7.58
2             83.50   7.67
3             80.50   7.17
4             79.33   7.17
5             83.83   7.58
6             84.17   7.75
7             83.67   8.17
8             81.92   7.50
9             82.67   7.58
10            83.42   7.67
Use slice_sample() for data frames, and sample() for vectors.
slice_sample()
sample()
cup_points_samp <- sample(coffee_ratings$total_cup_points, size = 10)
88.25 83.83 83.17 82.67 84.67 83.42 73.67 86.00 81.58 80.92
A population parameter is a calculation made on the population dataset.
mean(pts_vs_flavor_pop$total_cup_points)
82.15
A point estimate or sample statistic is a calculation made on the sample dataset.
mean(cup_points_samp)
82.82
pts_vs_flavor_pop %>%
  summarize(mean_flavor = mean(flavor))
  mean_flavor
1       7.526
pts_vs_flavor_samp %>%
  summarize(mean_flavor = mean(flavor))
  mean_flavor
1       7.716