Stratified and weighted random sampling
Sampling in R

Richie Cotton
Data Evangelist at DataCamp
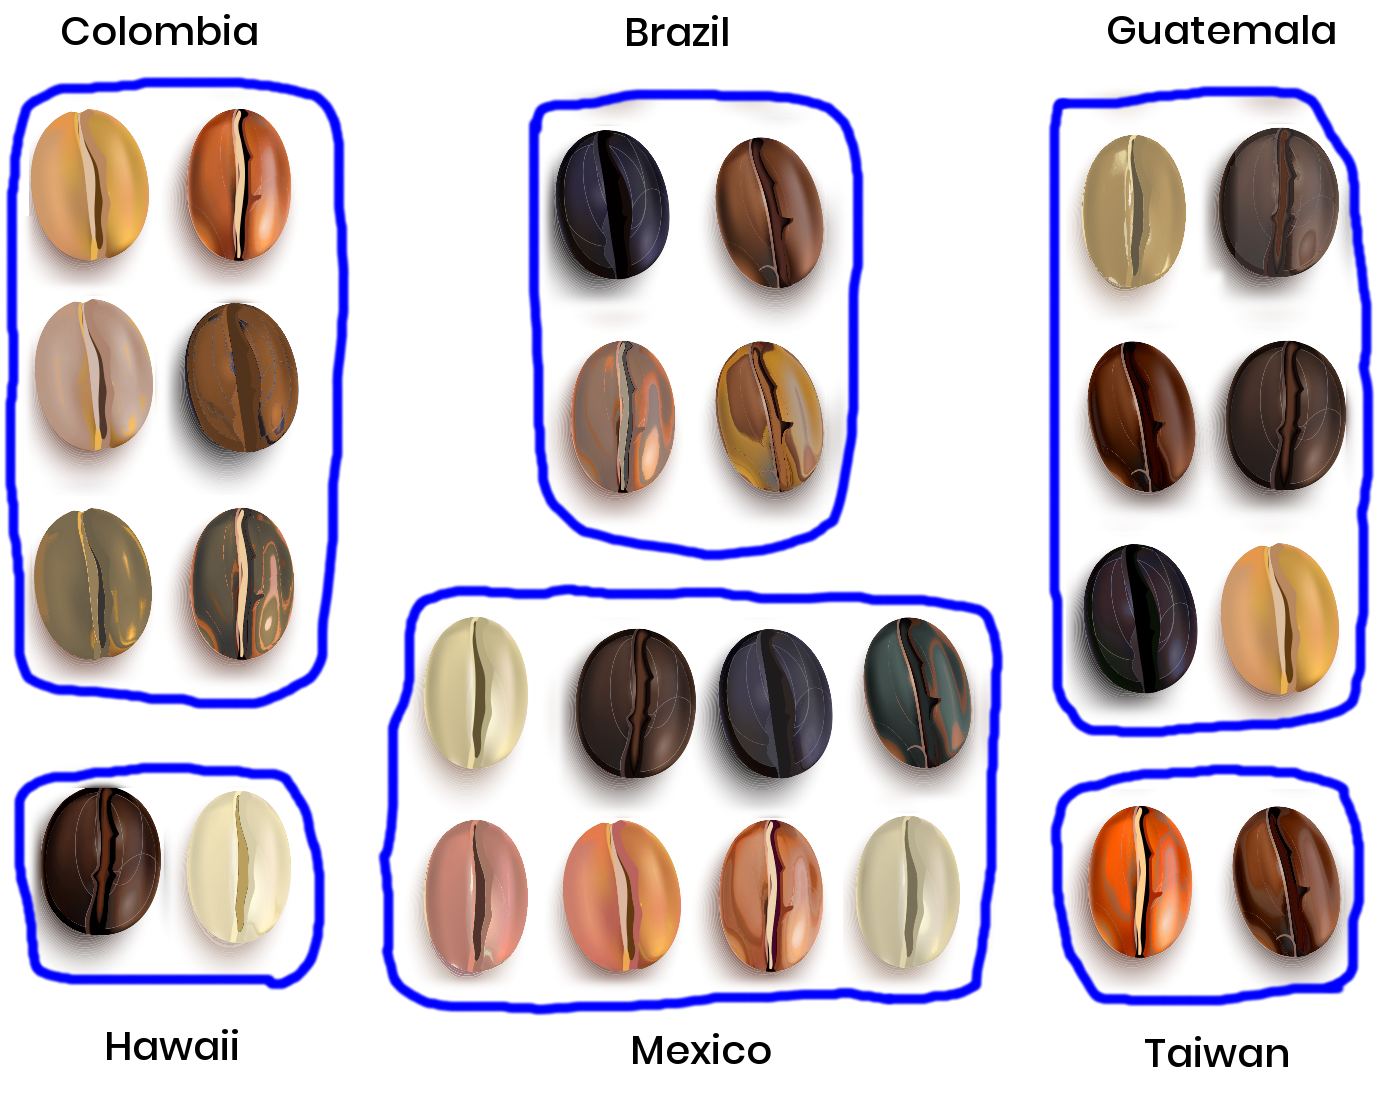
Coffees by country
top_counts <- coffee_ratings %>%
  count(country_of_origin, sort = TRUE) %>%
  head()
# A tibble: 6 x 2
  country_of_origin          n
  <chr>                  <int>
1 Mexico                   236
2 Colombia                 183
3 Guatemala                181
4 Brazil                   132
5 Taiwan                    75
6 United States (Hawaii)    73
1 The dataset lists Hawaii and Taiwan as countries for convenience, as they are notable coffee growing regions.
Filtering for 6 countries
top_counted_countries <- c(
  "Mexico", "Colombia", "Guatemala",
  "Brazil", "Taiwan", "United States (Hawaii)"
)
coffee_ratings_top <- coffee_ratings %>%
    filter(country_of_origin %in% top_counted_countries)
Or, equivalently
coffee_ratings_top <- coffee_ratings %>%
  semi_join(top_counts)
1 Learn about semi joins in "Joining Data with dplyr", Chapter 3.
Counts of a simple random sample
coffee_ratings_samp <- coffee_ratings_top %>%
  slice_sample(prop = 0.1)
coffee_ratings_samp %>%
  count(country_of_origin, sort = TRUE) %>%
  mutate(percent = 100 * n / sum(n))
# A tibble: 6 x 3
  country_of_origin          n percent
  <chr>                  <int>   <dbl>
1 Guatemala                 24    27.3
2 Mexico                    23    26.1
3 Brazil                    12    13.6
4 Colombia                  11    12.5
5 Taiwan                     9    10.2
6 United States (Hawaii)     9    10.2
Comparing counts
Population
# A tibble: 6 x 3
  country_of_origin          n percent
  <chr>                  <int>   <dbl>
1 Mexico                   236   26.8
2 Colombia                 183   20.8
3 Guatemala                181   20.6
4 Brazil                   132   15
5 Taiwan                    75    8.52
6 United States (Hawaii)    73    8.30
10% sample
# A tibble: 6 x 3
  country_of_origin          n percent
  <chr>                  <int>   <dbl>
1 Guatemala                 24    27.3
2 Mexico                    23    26.1
3 Brazil                    12    13.6
4 Colombia                  11    12.5
5 Taiwan                     9    10.2
6 United States (Hawaii)     9    10.2
Proportional stratified sampling
coffee_ratings_strat <- coffee_ratings_top %>%
  group_by(country_of_origin) %>%
  slice_sample(prop = 0.1) %>%
  ungroup()
coffee_ratings_strat %>%
  count(country_of_origin, sort = TRUE) %>%
  mutate(percent = 100 * n / sum(n))
# A tibble: 6 x 3
  country_of_origin          n percent
  <chr>                  <int>   <dbl>
1 Mexico                    23   26.7
2 Colombia                  18   20.9
3 Guatemala                 18   20.9
4 Brazil                    13   15.1
5 Taiwan                     7    8.14
6 United States (Hawaii)     7    8.14
Equal counts stratified sampling
coffee_ratings_eq <- coffee_ratings_top %>%
  group_by(country_of_origin) %>%
  slice_sample(n = 15) %>%
  ungroup()
coffee_ratings_eq %>%
  count(country_of_origin, sort = TRUE) %>%
  mutate(percent = 100 * n / sum(n))
# A tibble: 6 × 3
  country_of_origin          n percent
  <chr>                  <int>   <dbl>
1 Brazil                    15    16.7
2 Colombia                  15    16.7
3 Guatemala                 15    16.7
4 Mexico                    15    16.7
5 Taiwan                    15    16.7
6 United States (Hawaii)    15    16.7
Weighted random sampling
coffee_ratings_weight <- coffee_ratings_top %>%
  mutate(
    weight = ifelse(country_of_origin == "Taiwan", 2, 1)
  ) %>%
  slice_sample(prop = 0.1, weight_by = weight)
coffee_ratings_weight %>%
  count(country_of_origin, sort = TRUE) %>%
  mutate(percent = 100 * n / sum(n))
10% weighted sample
# A tibble: 6 x 3
  country_of_origin          n percent
  <chr>                  <int>   <dbl>
1 Mexico                    23   26.1
2 Guatemala                 20   22.7
3 Taiwan                    15   17.0
4 Brazil                    12   13.6
5 Colombia                  10   11.4
6 United States (Hawaii)     8    9.09
Let's practice!
Sampling in R

