Advanced completions
Reshaping Data with tidyr

Jeroen Boeye
Head of Machine Learning, Faktion
Nesting connected variables
nuke_df
# A tibble: 5 x 4
  continent     country n_bombs decade
  <chr>         <chr>     <int>  <int>
1 North America USA           8   1940
2 Europe        USSR          1   1940
3 North America USA         188   1950
4 Europe        USSR         82   1950
5 Europe        UK           21   1950
Nesting connected variables
nuke_df %>%
  complete(
    continent,
    country,
    decade,
    fill = list(n_bombs = 0L)
  )
# A tibble: 12 x 4
   continent     country decade n_bombs
   <chr>         <chr>    <int>   <int>
 1 Europe        UK        1940       0
 2 Europe        UK        1950      21
 3 Europe        USA       1940       0
 4 Europe        USA       1950       0
 5 Europe        USSR      1940       1
 6 Europe        USSR      1950      82
 7 North America UK        1940       0
 8 North America UK        1950       0
# ... with 4 more rows
The nesting() function
nuke_df %>%
  complete(
    nesting(continent, country),
    decade,
    fill = list(n_bombs = 0L)
  )
# A tibble: 6 x 4
  continent     country decade n_bombs
  <chr>         <chr>    <int>   <int>
1 Europe        UK        1940       0
2 Europe        UK        1950      21
3 Europe        USSR      1940       1
4 Europe        USSR      1950      82
5 North America USA       1940       8
6 North America USA       1950     188
Counting tropical storms
storm_df
# A tibble: 35 x 3
   name      start      end
   <chr>     <date>     <date>
 1 ANDREA    2013-06-05 2013-06-08
 2 ARTHUR    2014-06-28 2014-07-09
 3 ANA       2015-05-06 2015-05-12
 4 BARRY     2013-06-16 2013-06-21
 5 TWO       2014-07-19 2014-07-23
 6 BILL      2015-06-16 2015-06-21
# ... with 29 more rows
Counting tropical storms: pivot to long format
storm_df %>%
  pivot_longer(
    -name,
    names_to = "status",
    values_to = "date"
  )
# A tibble: 70 x 3
   name   status date
   <chr>  <chr>  <date>
 1 ANDREA start  2013-06-05
 2 ANDREA end    2013-06-08
 3 ARTHUR start  2014-06-28
 4 ARTHUR end    2014-07-09
 5 ANA    start  2015-05-06
 6 ANA    end    2015-05-12
 7 BARRY  start  2013-06-16
 8 BARRY  end    2013-06-21
 9 TWO    start  2014-07-19
10 TWO    end    2014-07-23
# ... with 60 more rows
Counting tropical storms: grouped completion
storm_df %>%
  pivot_longer(
    -name,
    names_to = "status",
    values_to = "date"
  )  %>%
  group_by(name) %>%
  complete(date = full_seq(date, 1)) %>%
  ungroup()
# A tibble: 263 x 3
   name   date       status
   <chr>  <date>     <chr>
 1 ANA    2015-05-06 start
 2 ANA    2015-05-07 NA
 3 ANA    2015-05-08 NA
 4 ANA    2015-05-09 NA
 5 ANA    2015-05-10 NA
 6 ANA    2015-05-11 NA
 7 ANA    2015-05-12 end
 8 ANDREA 2013-06-05 start
 9 ANDREA 2013-06-06 NA
10 ANDREA 2013-06-07 NA
# ... with 253 more rows
Counting tropical storms: the actual count
storm_df %>%
  pivot_longer(
    -name,
    names_to = "status",
    values_to = "date"
  )  %>%
  group_by(name) %>%
  complete(date = full_seq(date, 1)) %>%
  ungroup() %>%
  count(date, name = "n_storms")
# A tibble: 227 x 2
   date       n_storms
   <date>        <int>
 1 2013-06-05        1
 2 2013-06-06        1
 3 2013-06-07        1
 4 2013-06-08        1
 5 2013-06-16        1
 6 2013-06-17        1
 7 2013-06-18        1
 8 2013-06-19        1
 9 2013-06-20        1
10 2013-06-21        1
# ... with 217 more rows
Counting tropical storms: adding zero counts
storm_df %>%
  pivot_longer(
    -name,
    names_to = "status",
    values_to = "date"
  )  %>%
  group_by(name) %>%
  complete(date = full_seq(date, 1)) %>%
  ungroup() %>%
  count(date, name = "n_storms") %>%
  complete(
    date = full_seq(date, 1),
    fill = list(n_storms = 0L)
  )
# A tibble: 892 x 2
   date       n_storms
   <date>        <int>
 1 2013-06-05        1
 2 2013-06-06        1
 3 2013-06-07        1
 4 2013-06-08        1
 5 2013-06-09        0
 6 2013-06-10        0
 7 2013-06-11        0
 8 2013-06-12        0
 9 2013-06-13        0
10 2013-06-14        0
# ... with 882 more rows
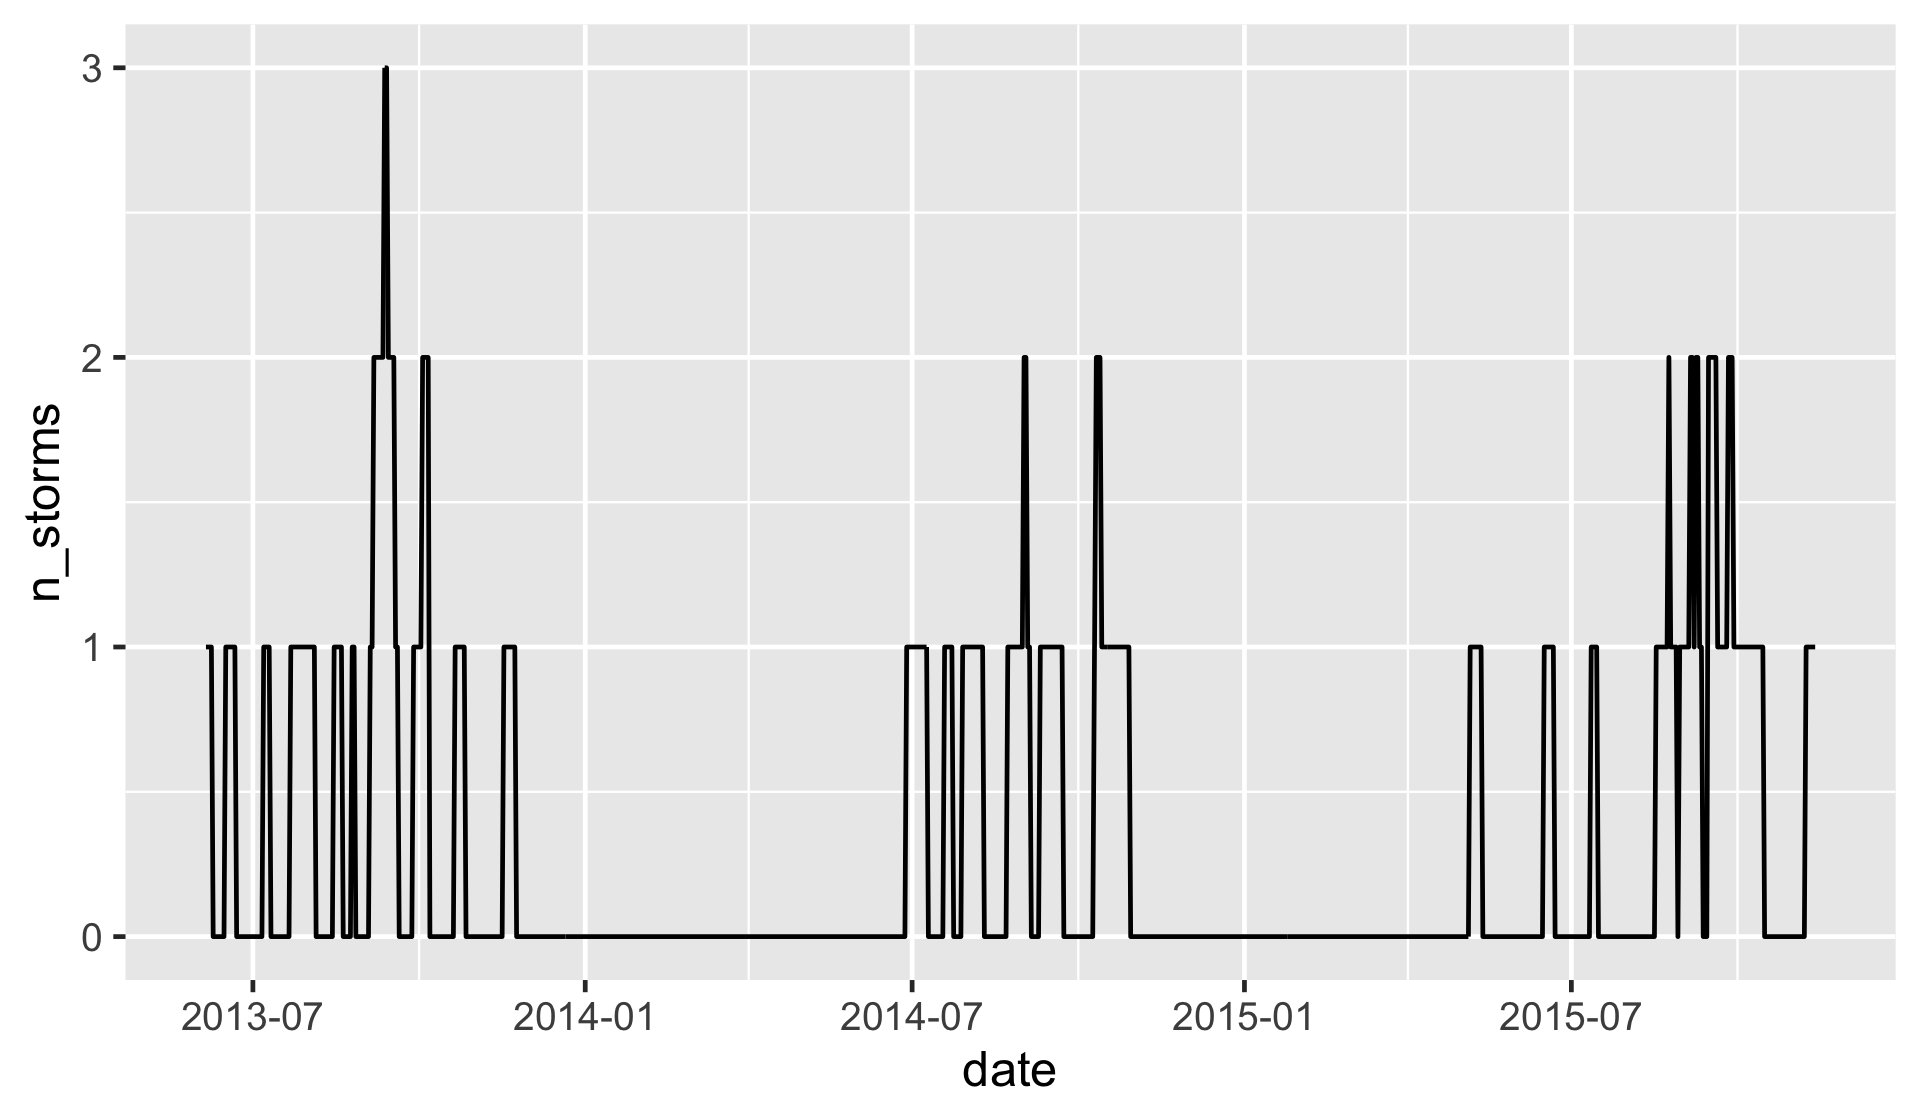
Counting tropical storms: visualizing the result
Timestamp completions
sensor_df
# A tibble: 3 x 2
  time                temperature
  <dttm>                    <int>
1 2020-01-01 11:00:00          25
2 2020-01-01 11:40:00          26
3 2020-01-01 12:20:00          25
Timestamp completions
sensor_df %>%
  complete(time = seq(from = min(time), to = max(time), by = "20 min"))
# A tibble: 5 x 2
  time                temperature
  <dttm>                    <int>
1 2020-01-01 11:00:00          25
2 2020-01-01 11:20:00          NA
3 2020-01-01 11:40:00          26
4 2020-01-01 12:00:00          NA
5 2020-01-01 12:20:00          25
Timestamp completions
sensor_df %>%
  complete(time = seq(from = min(time), to = max(time), by = "20 min")) %>%
  fill(temperature)
# A tibble: 5 x 2
  time                temperature
  <dttm>                    <int>
1 2020-01-01 11:00:00          25
2 2020-01-01 11:20:00          25
3 2020-01-01 11:40:00          26
4 2020-01-01 12:00:00          26
5 2020-01-01 12:20:00          25
Let's practice!
Reshaping Data with tidyr

