Reshaping Data with tidyr
Jeroen Boeye
Head of Machine Learning, Faktion
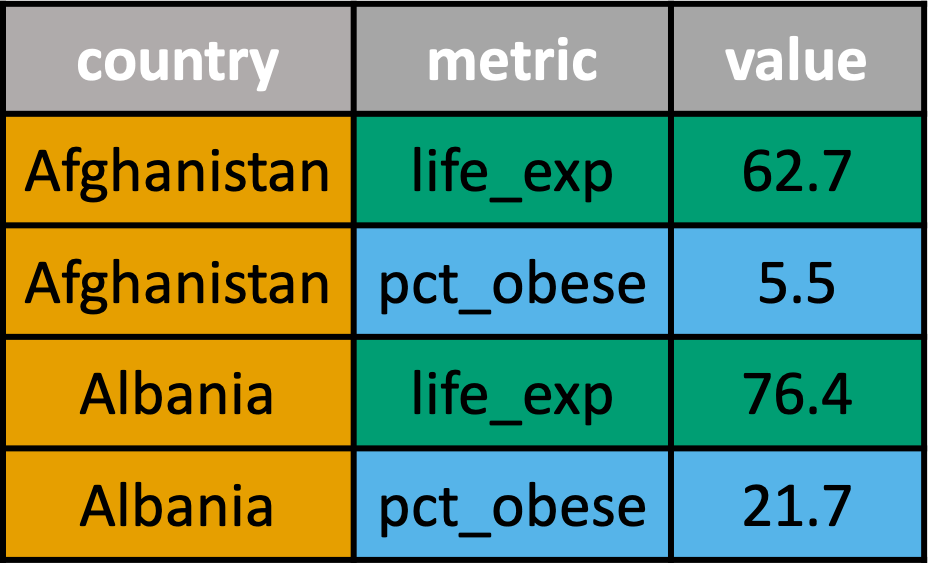
who_df
# A tibble: 362 x 3
   country             metric    value
   <chr>               <chr>     <dbl>
 1 Afghanistan         life_exp   62.7
 2 Afghanistan         pct_obese   5.5
 3 Albania             life_exp   76.4
 4 Albania             pct_obese  21.7
# ... with 358 more rows
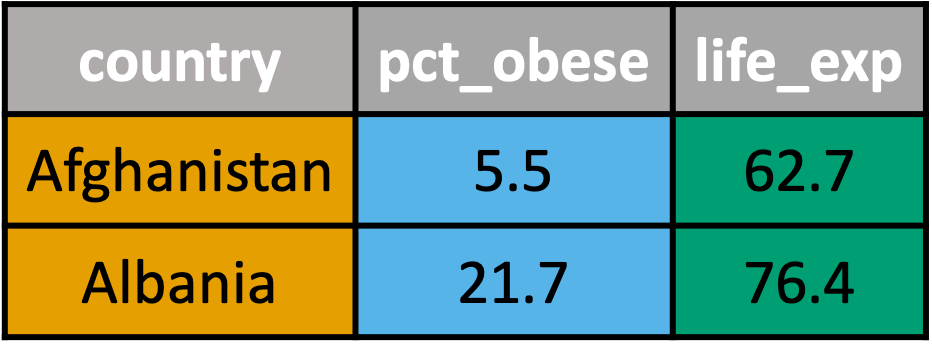
who_df %>%
  pivot_wider(names_from = metric, values_from = value)
# A tibble: 181 x 3
   country             life_exp pct_obese
   <chr>                  <dbl>     <dbl>
 1 Afghanistan             62.7       5.5
 2 Albania                 76.4      21.7
 3 Algeria                 76.4      27.4
 4 Angola                  62.6       8.2
# ... with 177 more rows
who_long_df %>%
  pivot_wider(names_from = metric, values_from = value, names_prefix = "national_")
# A tibble: 181 x 3
   country             national_life_exp national_pct_obese
   <chr>                           <dbl>              <dbl>
 1 Afghanistan                      62.7                5.5
 2 Albania                          76.4               21.7
 3 Algeria                          76.4               27.4
 4 Angola                           62.6                8.2
# ... with 177 more rows
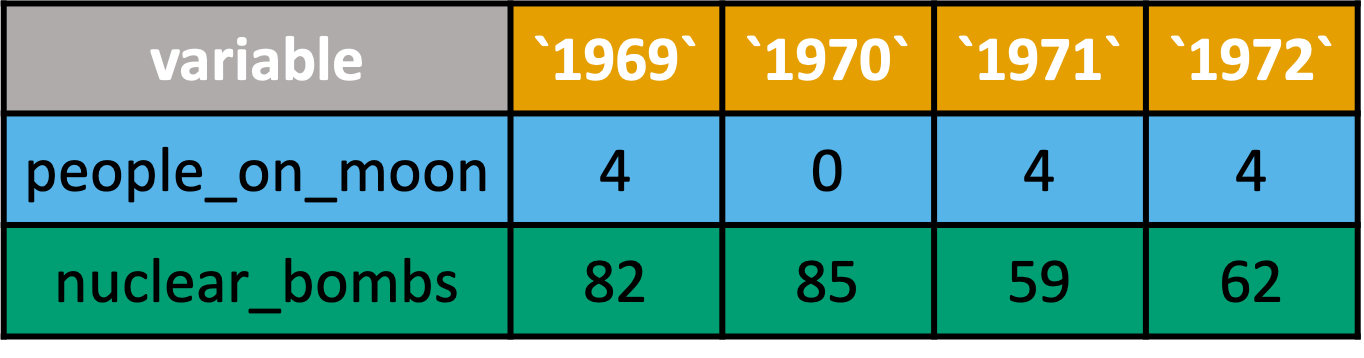
sideways_df
# A tibble: 2 x 5
  variable       `1969` `1970` `1971` `1972`
  <chr>           <int>  <int>  <int>  <int>
1 people_on_moon      4      0      4      4
2 nuclear_bombs      82     85     59     62
sideways_df %>%
  pivot_longer(-variable, names_to = "year", names_transform = list(year = as.integer))
# A tibble: 8 x 3
  variable       year  value
  <chr>          <int> <int>
1 people_on_moon 1969      4
2 people_on_moon 1970      0
3 people_on_moon 1971      4
4 people_on_moon 1972      4
5 nuclear_bombs  1969     82
6 nuclear_bombs  1970     85
7 nuclear_bombs  1971     59
8 nuclear_bombs  1972     62
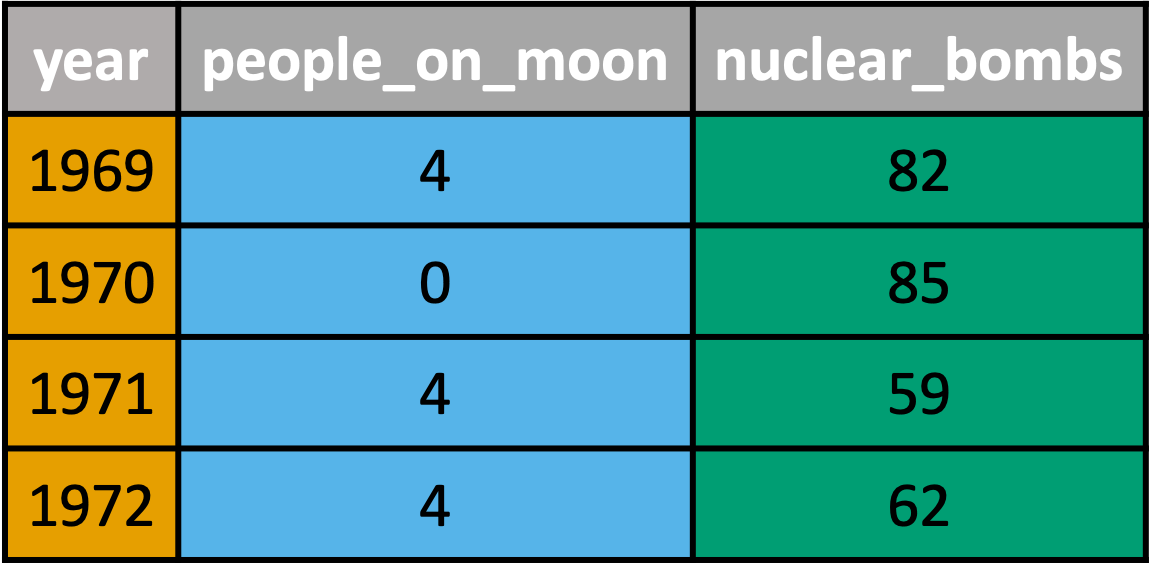
sideways_df %>%
  pivot_longer(-variable, names_to = "year", names_transform = list(year = as.integer)) %>%
  pivot_wider(names_from = variable, values_from = value)
# A tibble: 4 x 3
  year  people_on_moon nuclear_bombs
  <int>          <int>         <int>
1 1969               4            82
2 1970               0            85
3 1971               4            59
4 1972               4            62