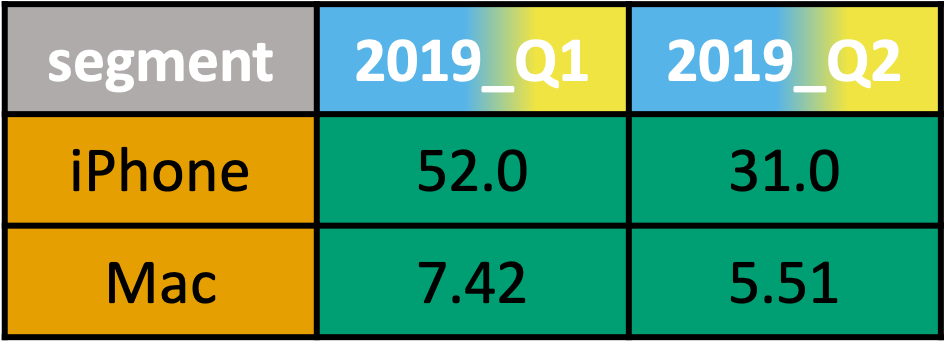
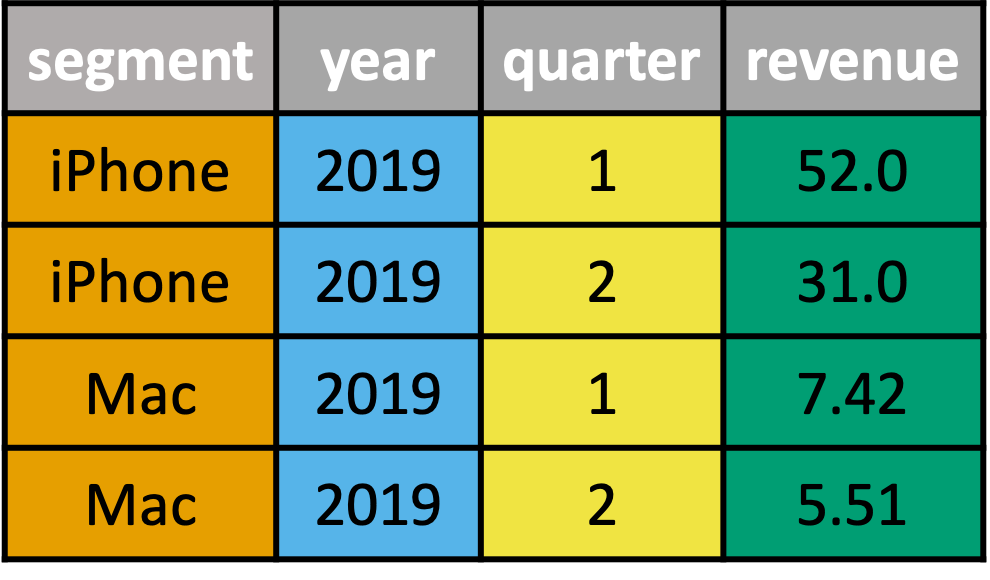
Deriving variables from complex column headers
Reshaping Data with tidyr

Jeroen Boeye
Head of Machine Learning, Faktion
Separating column headers into variables
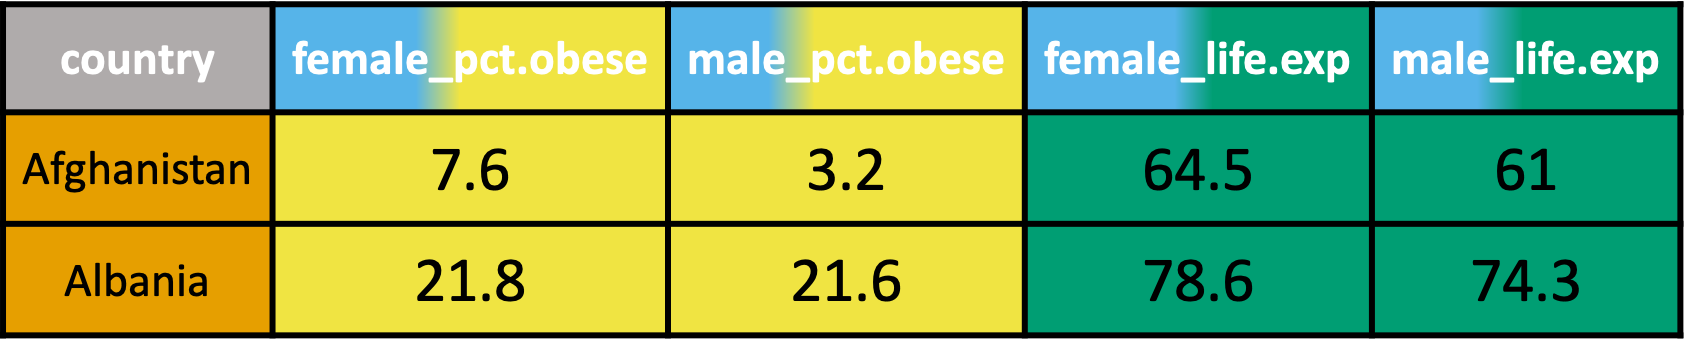
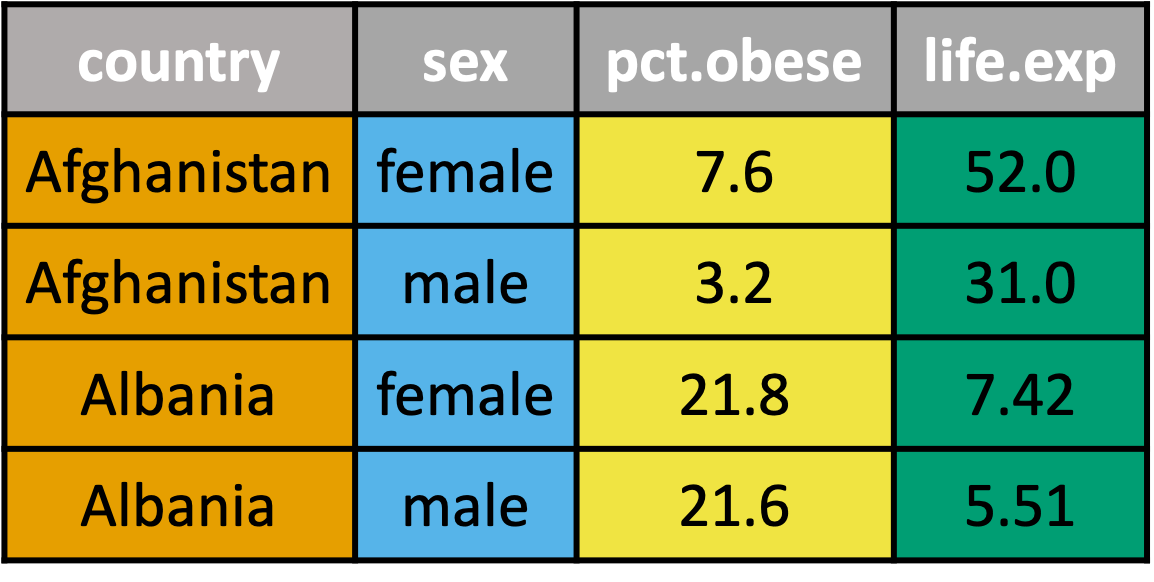
Multiple variable combinations in column headers
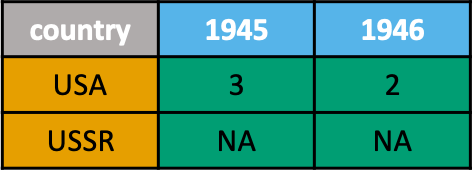
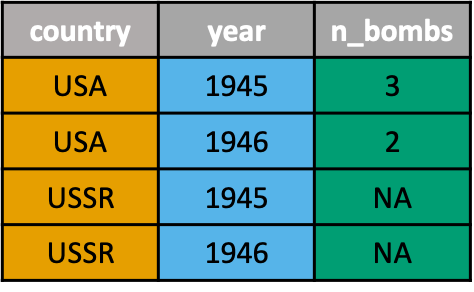
pivot_longer() recap
Reshaping Data with tidyr
Jeroen Boeye
Head of Machine Learning, Faktion

