The central limit theorem
Introduction to Statistics in Python

Maggie Matsui
Content Developer, DataCamp
Rolling the dice 5 times

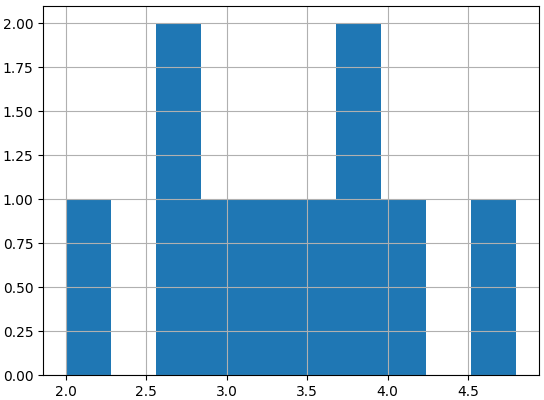
Sampling distributions
Sampling distribution of the sample mean
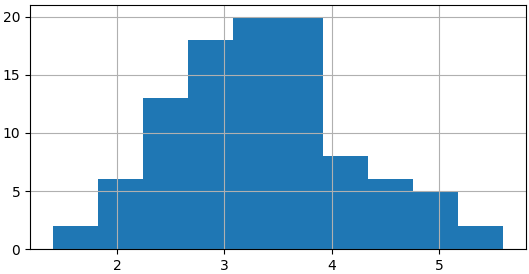
100 sample means
sample_means = []
for i in range(100):
    sample_means.append(np.mean(die.sample(5, replace=True)))
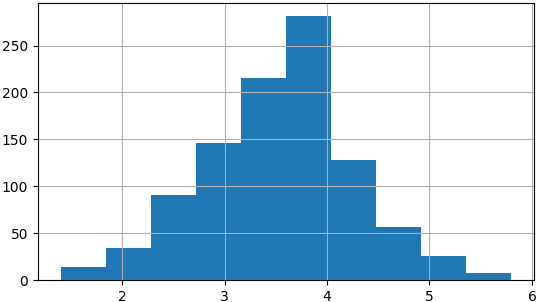
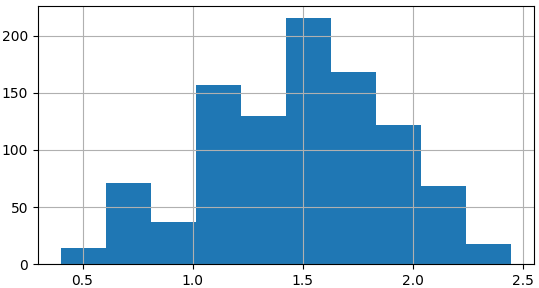
1000 sample means
sample_means = []
for i in range(1000):
    sample_means.append(np.mean(die.sample(5, replace=True)))
Central limit theorem
The sampling distribution of a statistic becomes closer to the normal distribution as the number of trials increases.
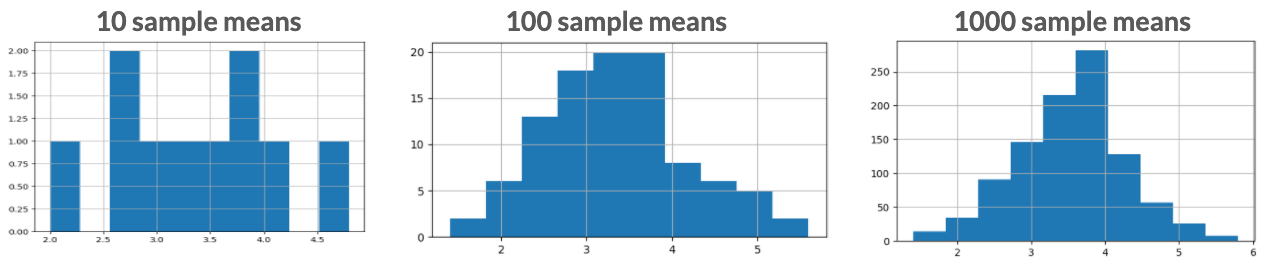
* Samples should be random and independent
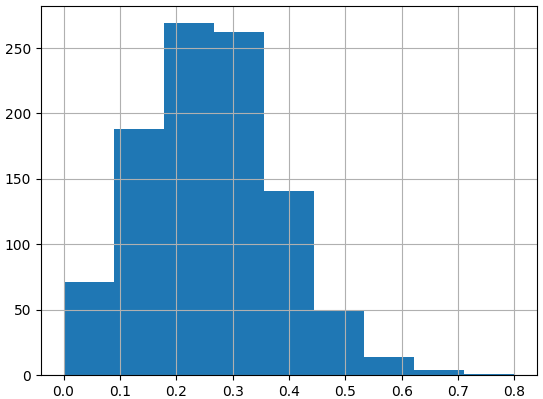
Standard deviation and the CLT
sample_sds = []
for i in range(1000):
  sample_sds.append(np.std(die.sample(5, replace=True)))
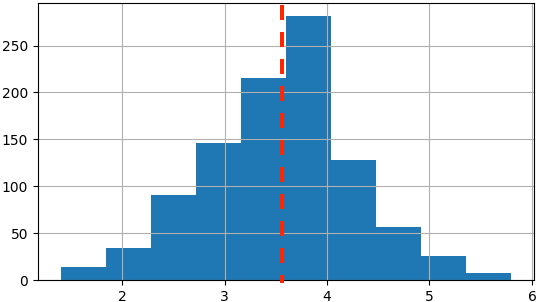
Sampling distribution of proportion
Mean of sampling distribution
- Estimate characteristics of unknown underlying distribution
- More easily estimate characteristics of large populations

