A/B testing
Bayesian Data Analysis in Python

Michal Oleszak
Machine Learning Engineer
A/B testing
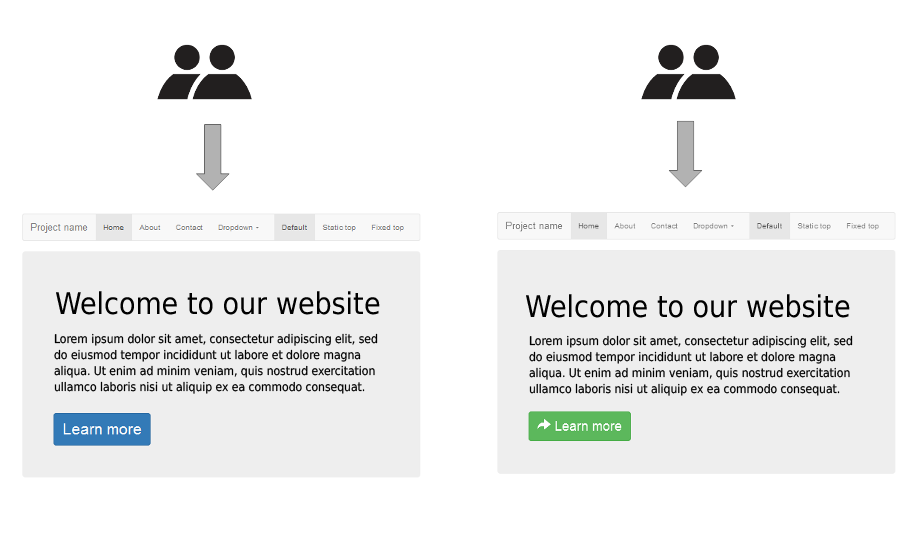
- Randomized experiment: divide users in two groups (A and B)

1 Picture: adapted from https://commons.wikimedia.org/wiki/File:A-B_testing_simple_example.png
A/B testing
- Randomized experiment: divide users in two groups (A and B)
- Expose each group to a different version of something (e.g. website layout)
1 Picture: adapted from https://commons.wikimedia.org/wiki/File:A-B_testing_simple_example.png
A/B testing
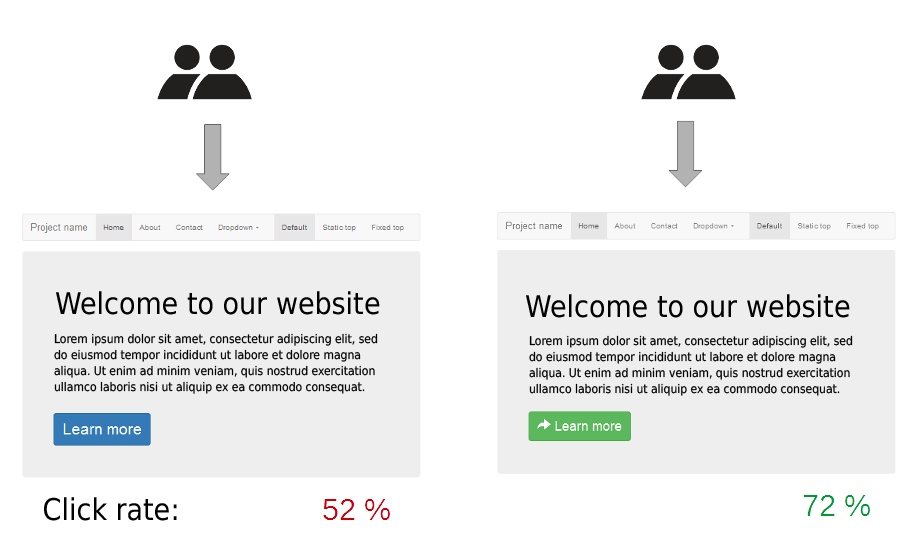
- Randomized experiment: divide users in two groups (A and B)
- Expose each group to a different version of something (e.g. website layout)
- Compare which group scores better on some metric (e.g. click-through rate)
1 Picture: adapted from https://commons.wikimedia.org/wiki/File:A-B_testing_simple_example.png
Comparing posteriors
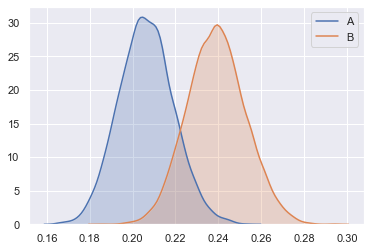
Plot posteriors:
sns.kdeplot(A_posterior, shade=True, label="A")
sns.kdeplot(B_posterior, shade=True, label="B")
plt.show()
Comparing posteriors
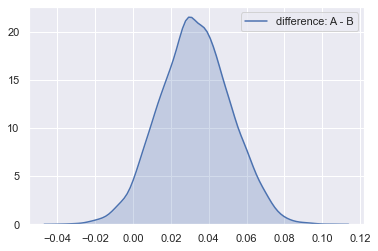
Posterior difference between B and A:
diff = B_posterior - A_posterior

sns.kdeplot(diff, shade=True, label="difference: A-B")
plt.show()