Under the Bayesian hood
Bayesian Data Analysis in Python

Michal Oleszak
Machine Learning Engineer
Bayes' Theorem revisited
$$P(A|B) = \frac{P(B|A) * P(A)}{P(B)}$$
Bayes' Theorem revisited
$$P(\text{parameters}|\text{data}) = \frac{P(\text{data}|\text{parameters}) * P(\text{parameters})}{P(\text{data})}$$
- P(parameters | data) → posterior distribution: what we know about the parameters after having seen the data
- P(parameters) → prior distribution: what we know about the parameters before seeing any data
- P(data | parameters) → likelihood of the data according to our statistical model
- P(data) → scaling factor
Tossing the coin again: grid approximation
Q: What's the probability of tossing heads with a coin, if we observed 75 heads in 100 tosses?
num_heads = np.arange(0, 101, 1) head_prob = np.arange(0, 1.01, 0.01)coin = pd.DataFrame([(x, y) for x in num_heads for y in head_prob]) coin.columns = ["num_heads", "head_prob"]
num_heads head_prob
0 0 0.00
1 0 0.01
2 0 0.02
... ...
10199 100 0.99
10200 100 1.00
[10201 rows x 2 columns]
Tossing the coin again: grid approximation
Q: What's the probability of tossing heads with a coin, if we observed 75 heads in 100 tosses?
from scipy.stats import uniform coin["prior"] = uniform.pdf(coin["head_prob"])
num_heads head_prob prior
0 0 0.00 1.0
1 0 0.01 1.0
2 0 0.02 1.0
... ... ...
10199 100 0.99 1.0
10200 100 1.00 1.0
[10201 rows x 3 columns]
Tossing the coin again: grid approximation
Q: What's the probability of tossing heads with a coin, if we observed 75 heads in 100 tosses?
from scipy.stats import uniform coin["prior"] = uniform.pdf(coin["head_prob"])from scipy.stats import binom coin["likelihood"] = binom.pmf(coin["num_heads"], 100, coin["head_prob"])
num_heads head_prob prior likelihood
0 0 0.00 1.0 1.000000
1 0 0.01 1.0 0.366032
2 0 0.02 1.0 0.132620
... ... ... ...
10199 100 0.99 1.0 0.366032
10200 100 1.00 1.0 1.000000
[10201 rows x 4 columns]
Tossing the coin again: grid approximation
Q: What's the probability of tossing heads with a coin, if we observed 75 heads in 100 tosses?
coin["posterior_prob"] = coin["prior"] * coin["likelihood"] coin["posterior_prob"] /= coin["posterior_prob"].sum()
num_heads head_prob prior likelihood posterior_prob
0 0 0.00 1.0 1.000000 0.009901
1 0 0.01 1.0 0.366032 0.003624
2 0 0.02 1.0 0.132620 0.001313
... ... ... ... ...
10199 100 0.99 1.0 0.366032 0.003624
10200 100 1.00 1.0 1.000000 0.009901
[10201 rows x 5 columns]
Tossing the coin again: grid approximation
Q: What's the probability of tossing heads with a coin, if we observed 75 heads in 100 tosses?
from scipy.stats import binom
from scipy.stats import uniform
num_heads = np.arange(0, 101, 1)
head_prob = np.arange(0, 1.01, 0.01)


coin = pd.DataFrame([(x, y) for x in num_heads for y in head_prob])
coin.columns = ["num_heads", "head_prob"]
coin["prior"] = uniform.pdf(coin["head_prob"])
coin["likelihood"] = binom.pmf(coin["num_heads"], 100, coin["head_prob"])
coin["posterior_prob"] = coin["prior"] * coin["likelihood"]
coin["posterior_prob"] /= coin["posterior_prob"].sum()
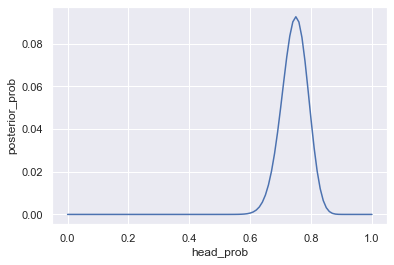
Plotting posterior distribution
Q: What's the probability of tossing heads with a coin, if we observed 75 heads in 100 tosses?
heads75 = coin.loc[coin["num_heads"] == 75]
heads75["posterior_prob"] /= heads75["posterior_prob"].sum()
      num_heads  head_prob  prior     likelihood  posterior_prob
7575         75       0.00    1.0   0.000000e+00    0.000000e+00
7576         75       0.01    1.0  1.886367e-127   1.867690e-129
         ...        ...    ...            ...             ...
7674         75       0.99    1.0   1.141263e-27    1.129964e-29
7675         75       1.00    1.0   0.000000e+00    0.000000e+00
[101 rows x 5 columns]
sns.lineplot(heads75["head_prob"], heads75["posterior_prob"])
plt.show()
Plotting posterior distribution
Q: What's the probability of tossing heads with a coin, if we observed 75 heads in 100 tosses? A:
Let's practice calculating posteriors using grid approximation!
Bayesian Data Analysis in Python

