Regression and forecasting
Bayesian Data Analysis in Python

Michal Oleszak
Machine Learning Engineer
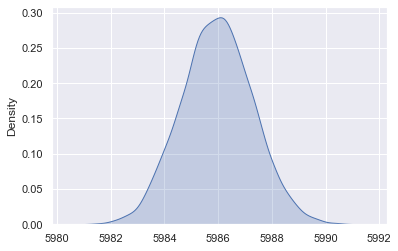
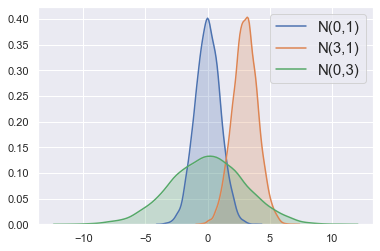
Normal distribution

Normal distribution

Normal distribution
Plot posterior
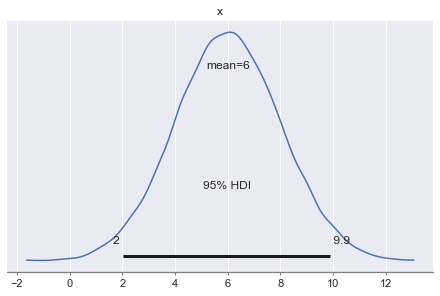
Predictive distribution
How much sales can we expect if we spend $1000 on marketing?