Reporting Bayesian results
Bayesian Data Analysis in Python

Michal Oleszak
Machine Learning Engineer
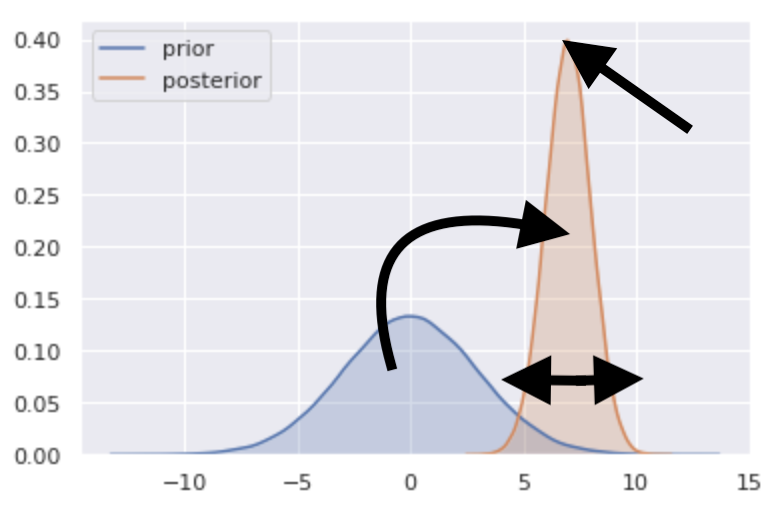
The honest way
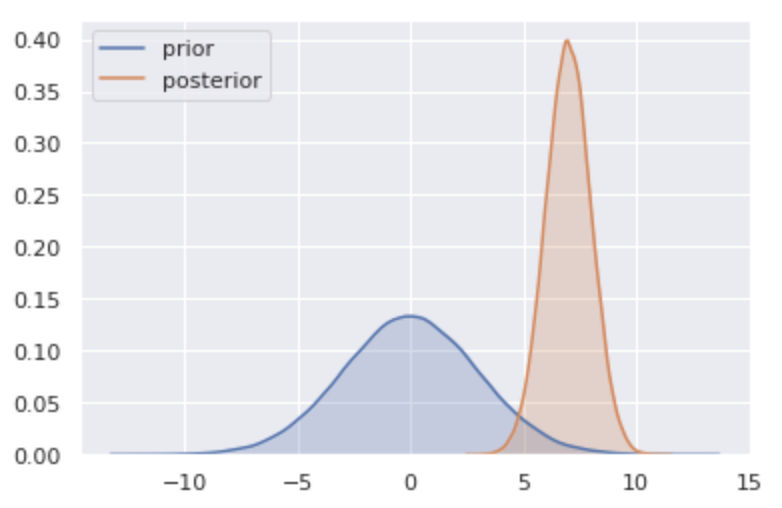
The honest way
The honest way
The honest way
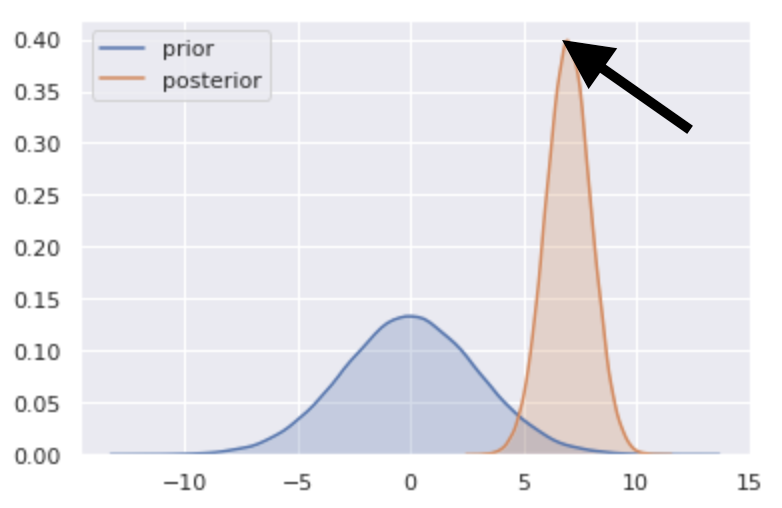
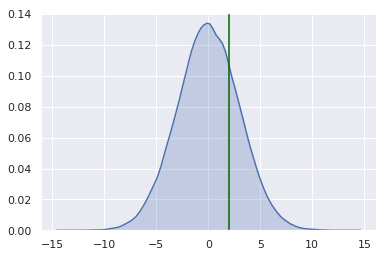
Bayesian point estimates
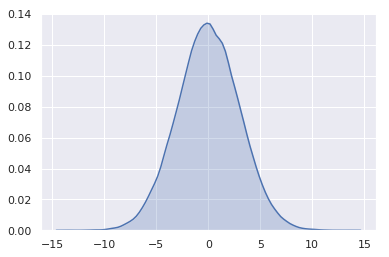
Bayesian point estimates

Bayesian point estimates
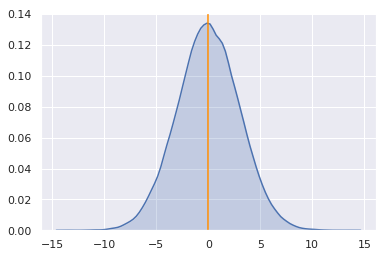
Bayesian point estimates
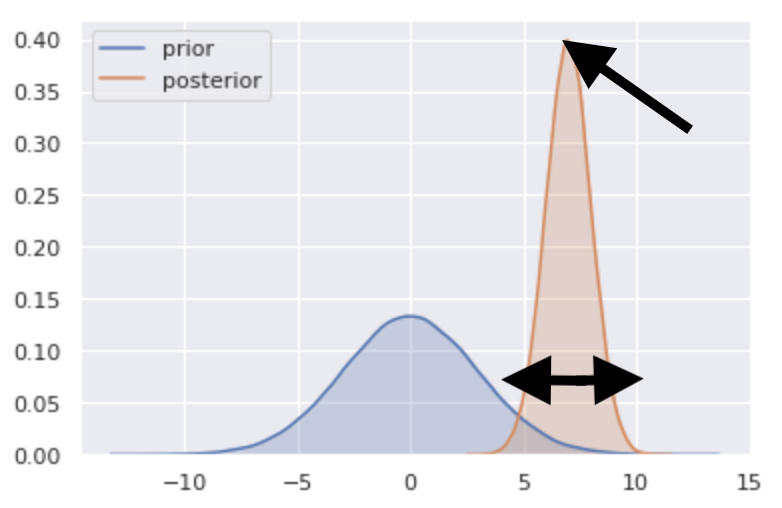
Credible intervals
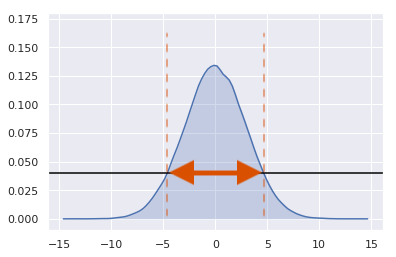
Highest Posterior Density (HPD)