Making predictions
Bayesian Data Analysis in Python

Michal Oleszak
Machine Learning Engineer
Number-of-clicks model again
formula = "num_clicks ~ clothes_banners_shown + sneakers_banners_shown + weekend"

with pm.Model() as model_2:
    pm.GLM.from_formula(formula, data=ads_aggregated)
    trace_2 = pm.sample(draws=1000, tune=500)
Ads test data
print(ads_test)
   clothes_banners_shown  sneakers_banners_shown  num_clicks  weekend
0                     40                      36           7     True
1                     42                      47           8    False
2                     45                      37          11    False
3                     22                      15           4    False
4                     20                      18           2    False
Sampling predictive draws
with pm.Model() as model:pm.GLM.from_formula(formula, data=ads_test)posterior_predictive = pm.fast_sample_posterior_predictive(trace_2)
Predictive draws
posterior_predictive["y"].shape
(4000, 5)
print(posterior_predictive["y"])
array([[12.83527253, 10.22454815, 11.20386868,  7.50227286,  6.85458594],
       [ 3.1015655 ,  6.1253004 , 11.38324931,  2.1844722 ,  4.21451756],
       [ 3.40141276,  9.10157964,  6.57689421,  8.26669814,  4.23812161],
       ...,
       [10.97303606,  9.0772305 , 10.6877039 ,  1.78448969,  6.75663075],
       [ 8.53734584, 12.14079593, 11.00969881,  4.69875055,  8.317338  ],
       [16.44713387, 17.35163824, 19.59359831,  2.84058536,  4.21108186]])
How good is the prediction?
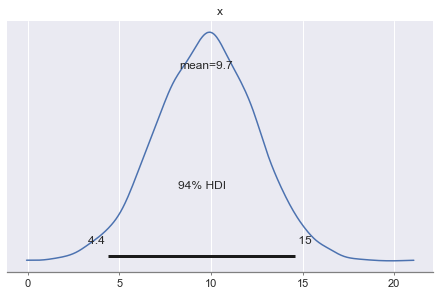
   clothes_banners_shown  sneakers_banners_shown  num_clicks  weekend
0                     40                      36           7     True
pm.plot_posterior(posterior_predictive["y"][:, 0])

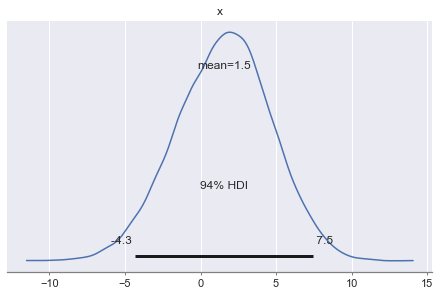
Test error distribution
errors = []for index, test_example in ads_test.iterrows():error = posterior_predictive["y"][:, index] - test_example["num_clicks"]errors.append(error)error_distribution = np.array(errors).reshape(-1)error_distribution.shape
(20000,)
pm.plot_posterior(error_distribution)
Test error distribution

Let's make predictions!
Bayesian Data Analysis in Python

