Who is Bayes? What is Bayes?

Bayesian Data Analysis in Python

Michal Oleszak

Machine Learning Engineer

Who is Bayes?

Thomas Bayes

1 Public Domain, https://commons.wikimedia.org/w/index.php?curid=14532025
Bayesian Data Analysis in Python

Should you take your umbrella?

A weatherperson forecasting 50% or rain.

Heavy, dark clouds and a thunder.

Bayesian Data Analysis in Python

What is Bayes?

  • Bayesian inference means updating one's belief about something as the new information becomes available.
Bayesian Data Analysis in Python

What is Bayes?

  • Bayesian inference means updating one's belief about something as the new information becomes available.

  • It is quite different from the classical approach.


Frequentist (classical) approach Bayesian approach
probability
parameters
Bayesian Data Analysis in Python

What is Bayes?

  • Bayesian inference means updating one's belief about something as the new information becomes available.

  • It is quite different from the classical approach.


Frequentist (classical) approach Bayesian approach
probability proportion of outcomes degree of belief
parameters fixed values random variables
Bayesian Data Analysis in Python

It pays to go Bayes!

  • Natural handling of uncertainty (because parameters have distributions!).
  • Possibility to include expert opinion or domain knowledge in the model (because probability means the degree of belief!).
  • No need to rely on fixed constants such as p-values.
  • Statistically correct even with little data.
  • Often coincides with frequentist results, but offers more flexibility to build custom models.
Bayesian Data Analysis in Python

Probability distributions

  • A distribution of a random variable specifies what values this variable can take, and with what probabilities.
  • Can be discrete (finite set of possible values) or continuous (infinitely many possible values)
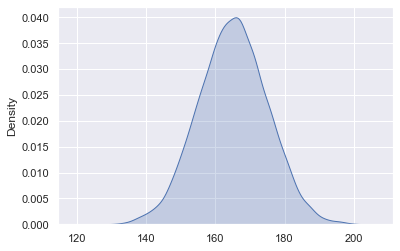
  • Continuous distributions can be visualized on a density plot.

A symmetric, bell-shaped curve peaking around the X-axis value of 165.

Bayesian Data Analysis in Python

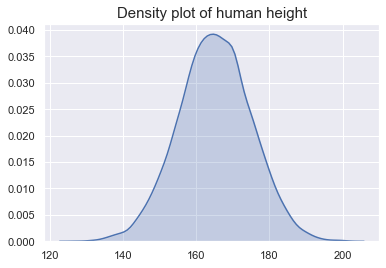
Distributions in Python

print(draws)
[146.58686154393, 159.40688614250, ..., ]


print(len(draws))
10000
import matplotlib.pyplot as plt
import seaborn as sns
sns.kdeplot(draws, shade=True)
plt.show()

A symmetric, bell-shaped curve peaking around the X-axis value of 165.

Bayesian Data Analysis in Python

Let's go Bayes!

Bayesian Data Analysis in Python

Preparing Video For Download...