Decision analysis
Bayesian Data Analysis in Python

Michal Oleszak
Machine Learning Engineer
Decision analysis
- Decision-makers care about maximizing profit, reducing costs, saving lives, etc.
Decision analysis
- Decision-makers care about maximizing profit, reducing costs, saving lives, etc.
- Decision analysis → translating parameters to relevant metrics to inform decision-making
From posteriors to decisions
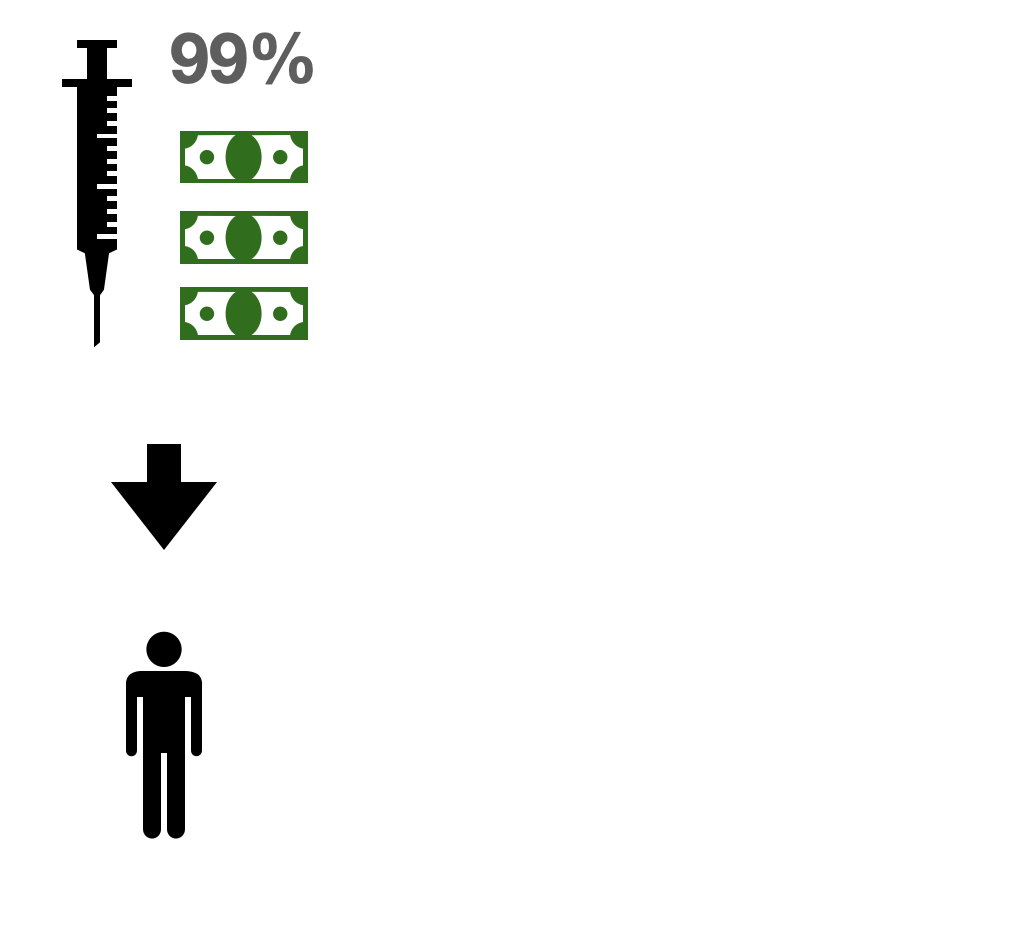
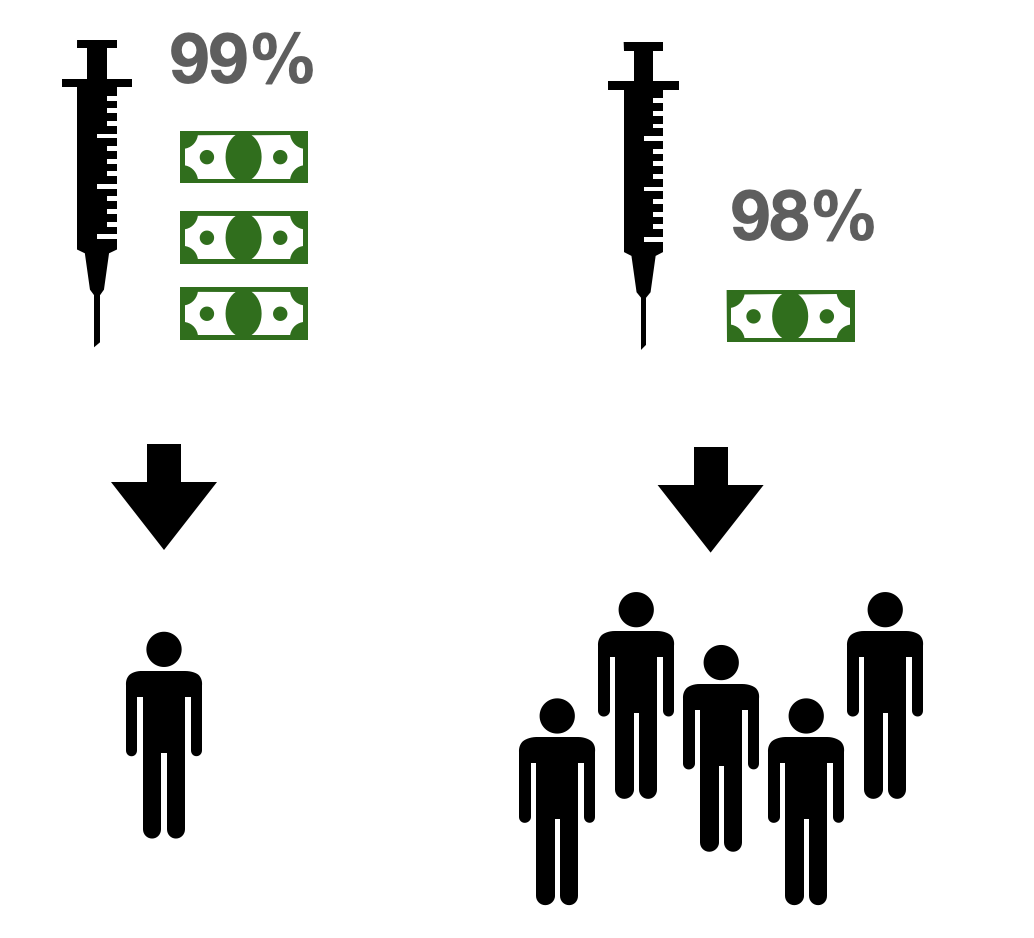
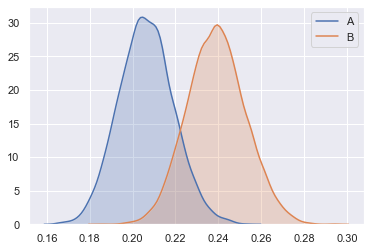
- To make strategic decisions, one should know the probabilities of different scenarios.
- Bayesian methods allow us to translate parameters into relevant metrics easily.

From posteriors to decisions
- To make strategic decisions, one should know the probabilities of different scenarios.
- Bayesian methods allow us to translate parameters into relevant metrics easily.

From posteriors to decisions
- To make strategic decisions, one should know the probabilities of different scenarios.
- Bayesian methods allow us to translate parameters into relevant metrics easily.

From posteriors to decisions
- To make strategic decisions, one should know the probabilities of different scenarios.
- Bayesian methods allow us to translate parameters into relevant metrics easily.
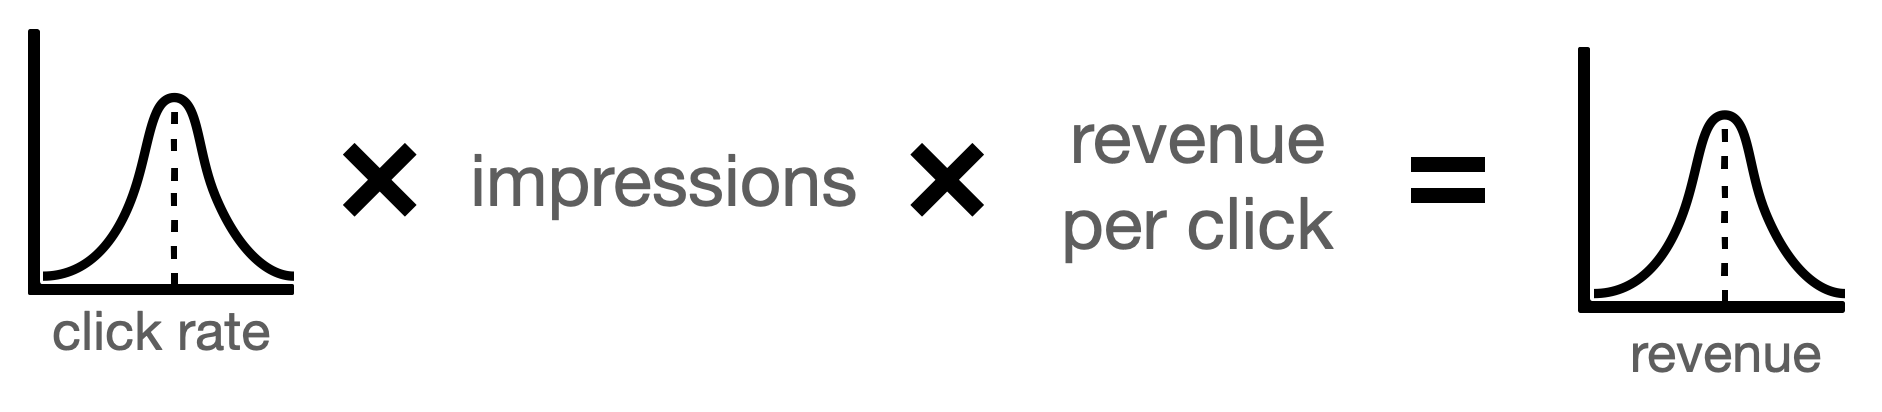
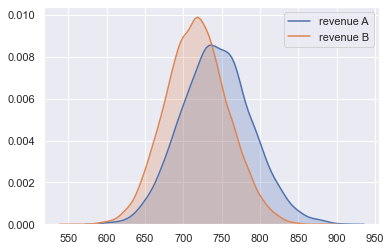
Posterior revenue
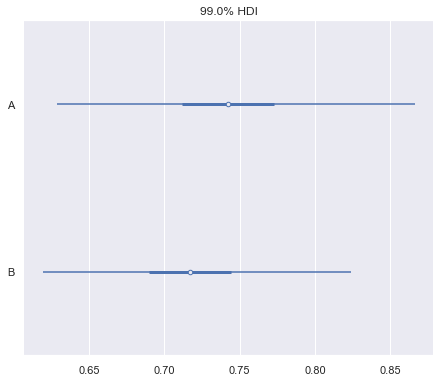
Forest plot
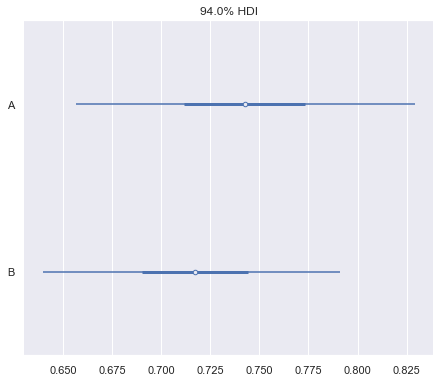
Forest plot