Adding annotations
Introduction to Data Visualization with Plotly in Python

Alex Scriven
Data Scientist
What are annotations?
- Extra boxes of text and data added to a plot
$$
- Draw attention to a particular data point
- Add extra notes to a plot

Creating annotations
$$
- Using
add_annotation()- Adds a single annotation
$$
- Using
update_layout()and theannotationsargument- Accepts a list of annotation objects
Important annotation arguments
text- The actual text to be displayed- Can include variables
$$
xandy: specify the location of the annotation
$$
showarrow=True/False- used to include an arrow- The arrow can be customized
$$
🛑 Be careful placing annotations absolutely - if your data changes, things may overlap
Positioning annotations
- By default,
xandyrefer to the data values in the plot
$$
- Set
xrefandyreftopaperto position annotations absolutely- Then
xandyare percentages from 0 to 1 across the plot area - (
x=0.5,y=0.5) would be in the center of the plot
- Then
Data-linked annotations
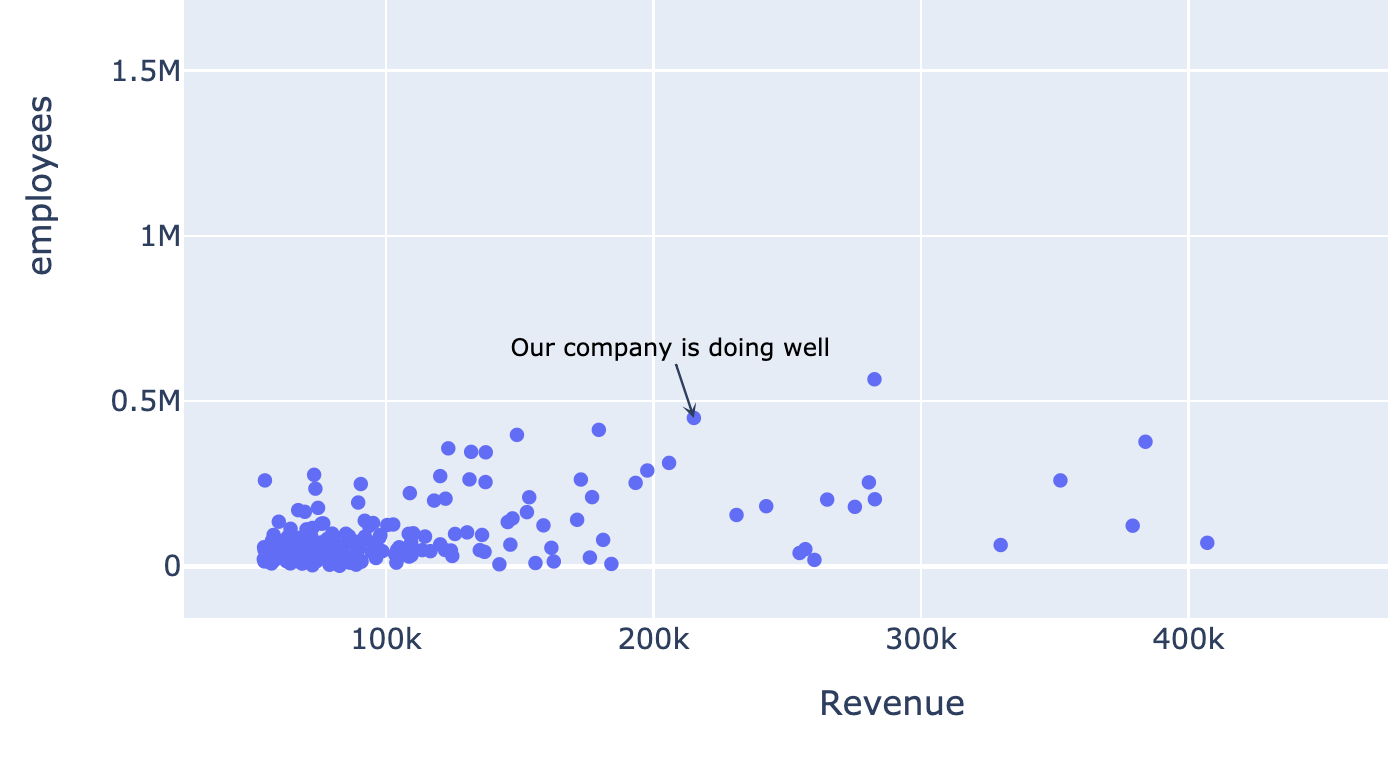
- Highlighting the company in a scatterplot
my_annotation = dict( x=215111, y=449000,showarrow=True, arrowhead=3,text="Our company is doing well", font=dict(size=10, color="black") )fig.update_layout(annotations=[my_annotation]) fig.show()
$$

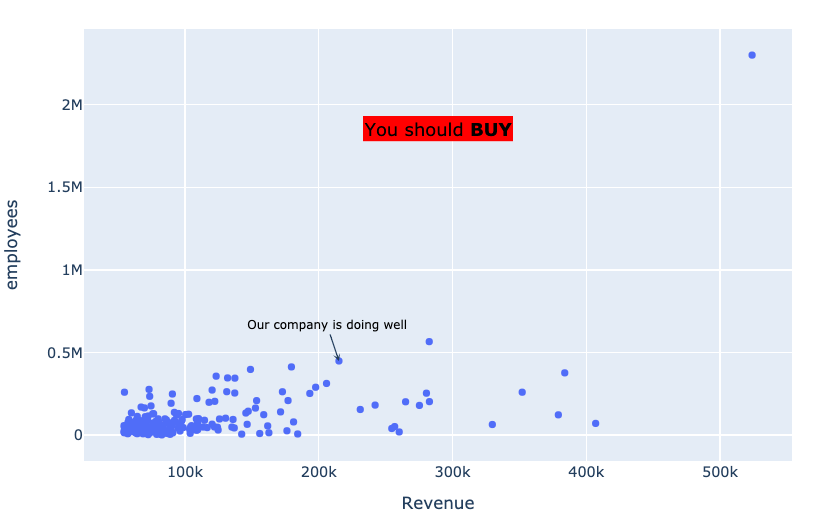
Floating annotation
$$
float_annotation = dict( xref="paper", yref="paper",x=0.5, y=0.8,showarrow=False, text="You should <b>BUY</b>", font=dict(size=15, color="black"), bgcolor="rgb(255,0,0)" )

Let's practice!
Introduction to Data Visualization with Plotly in Python

