Adding annotations
Introduction to Data Visualization with Plotly in Python

Alex Scriven
Data Scientist
What are annotations?
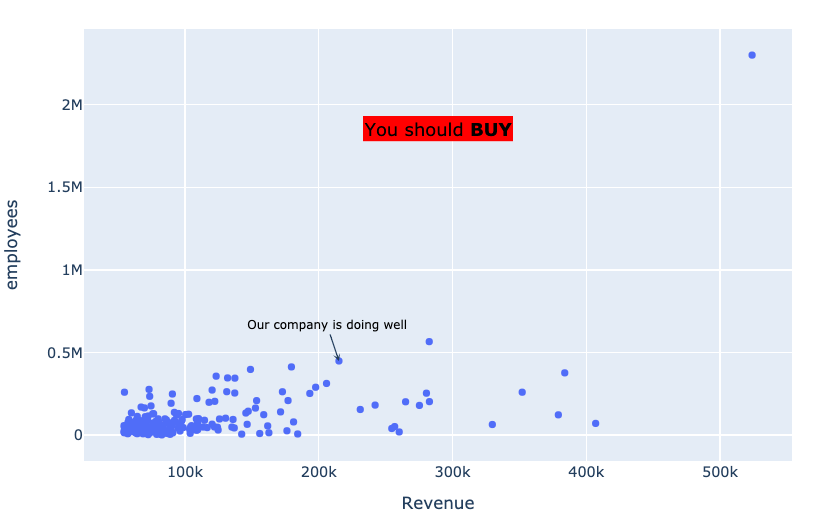
- Extra boxes of text and data added to a plot
$$
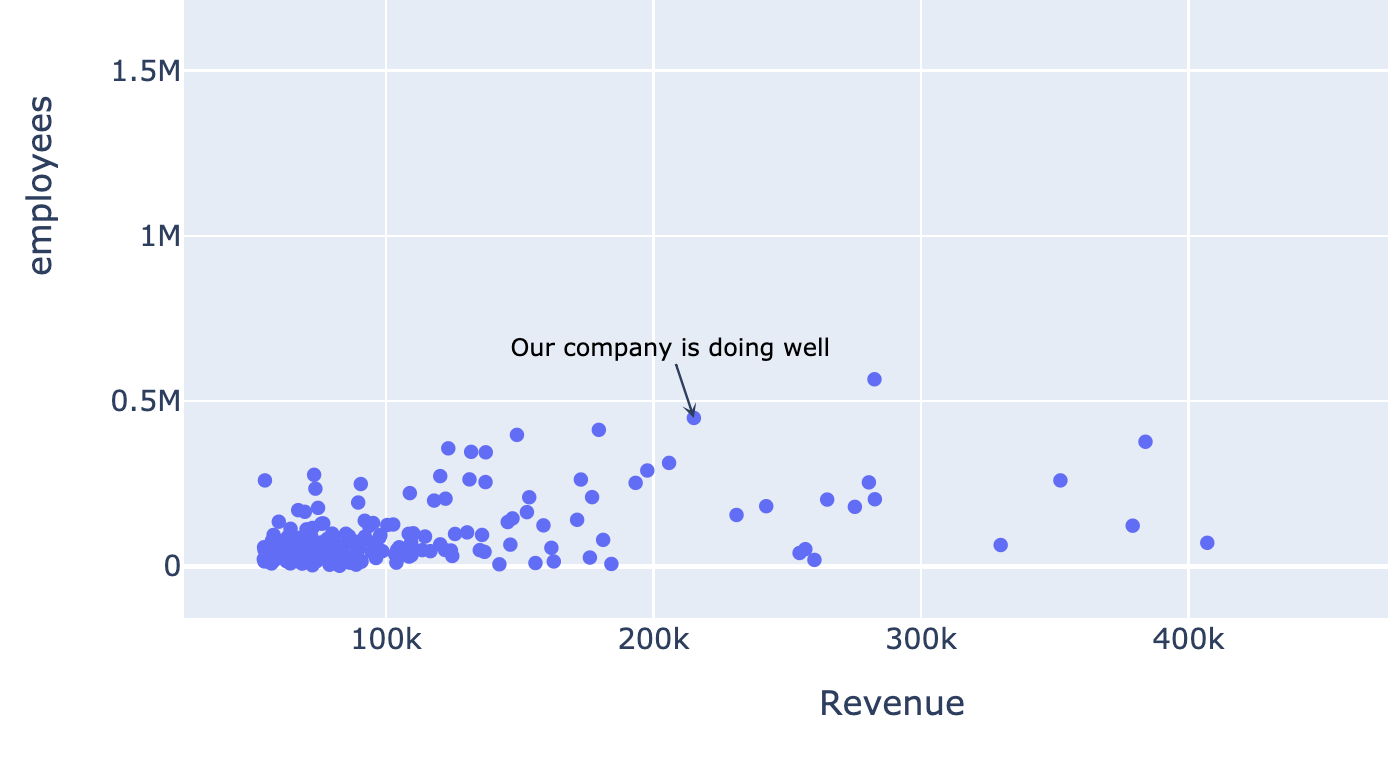
- Draw attention to a particular data point
- Add extra notes to a plot
Data-linked annotations
$$
Floating annotation