Customizing color
Introduction to Data Visualization with Plotly in Python

Alex Scriven
Data Scientist
Why customize color?
Some color theory
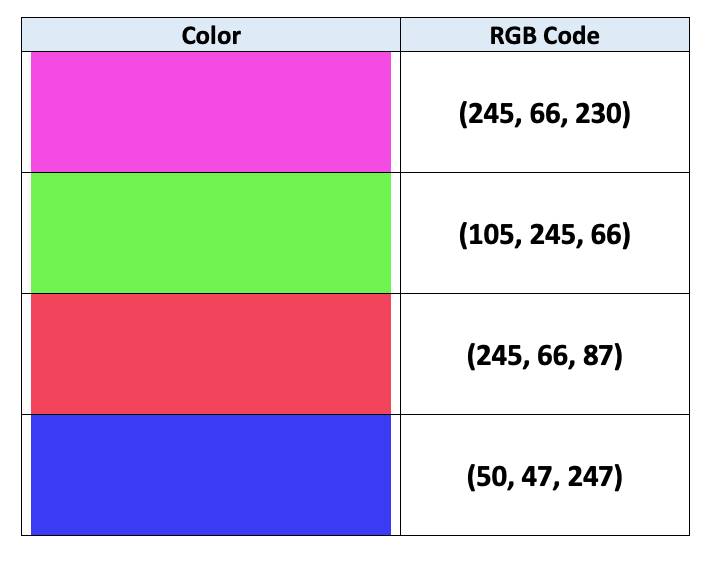
Our colors revealed
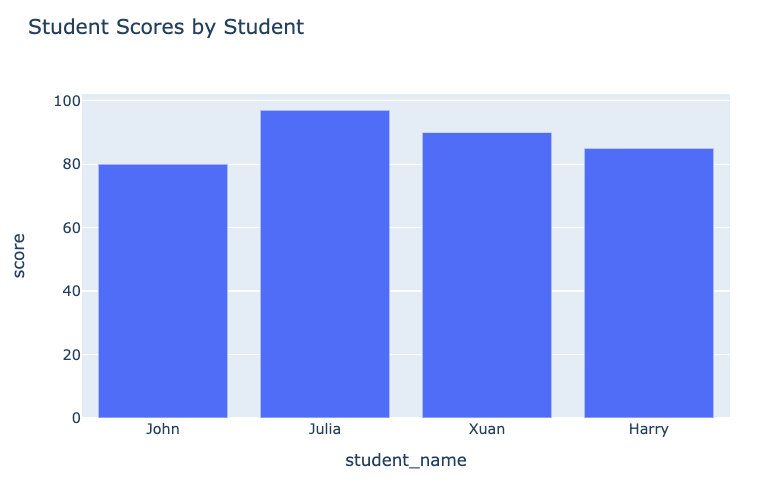
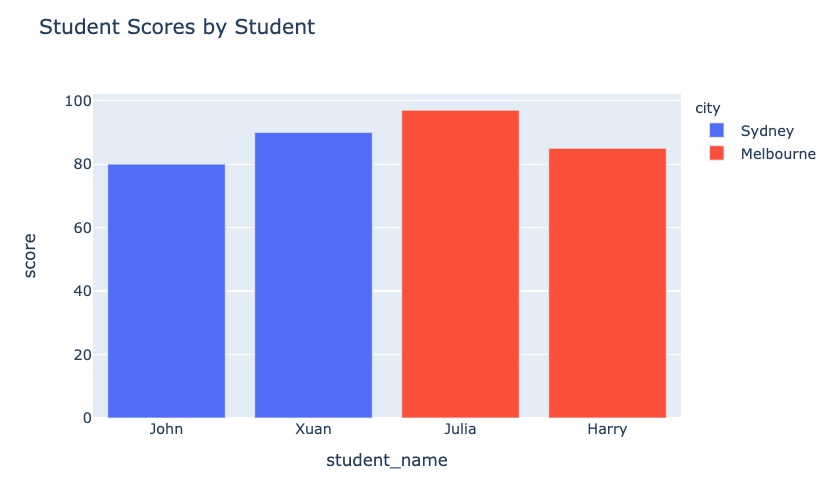
The plot before:
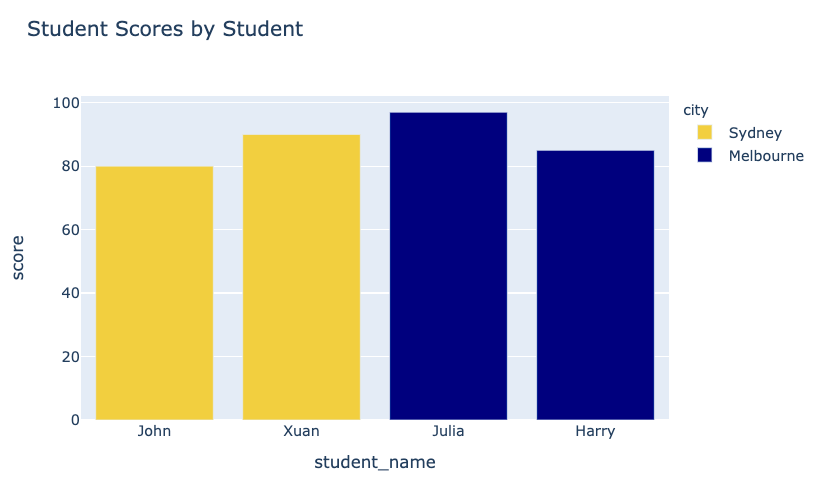
Our plot after:
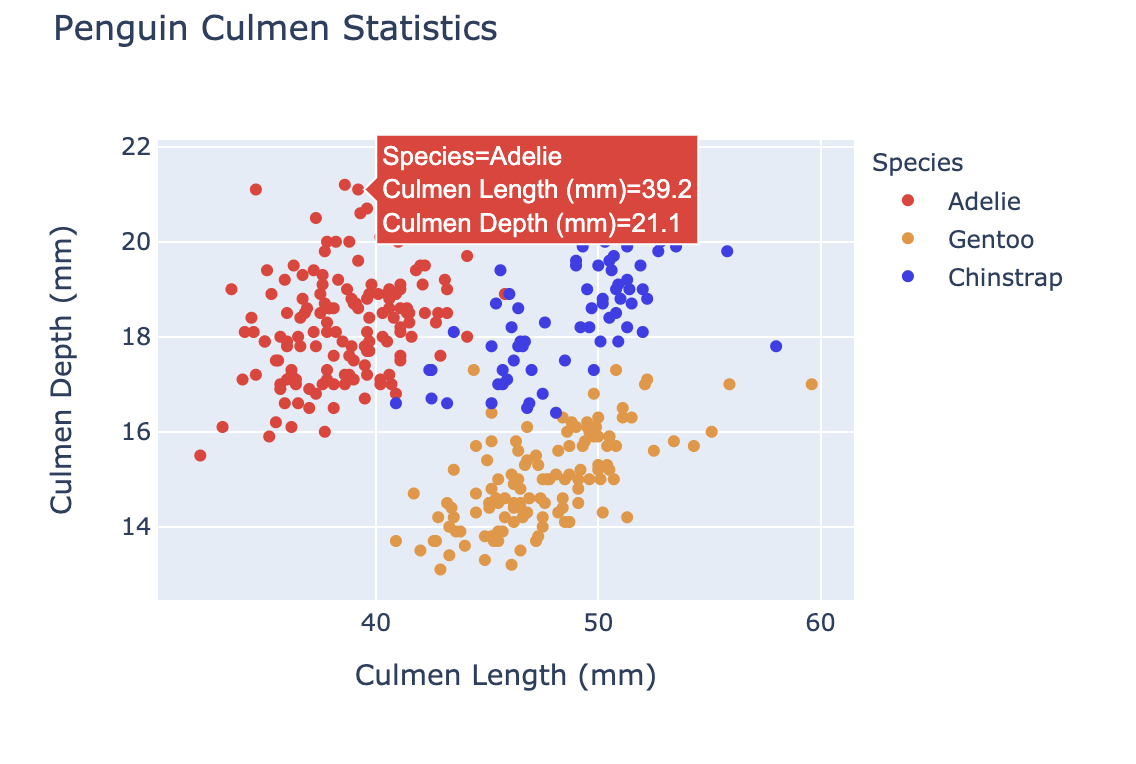
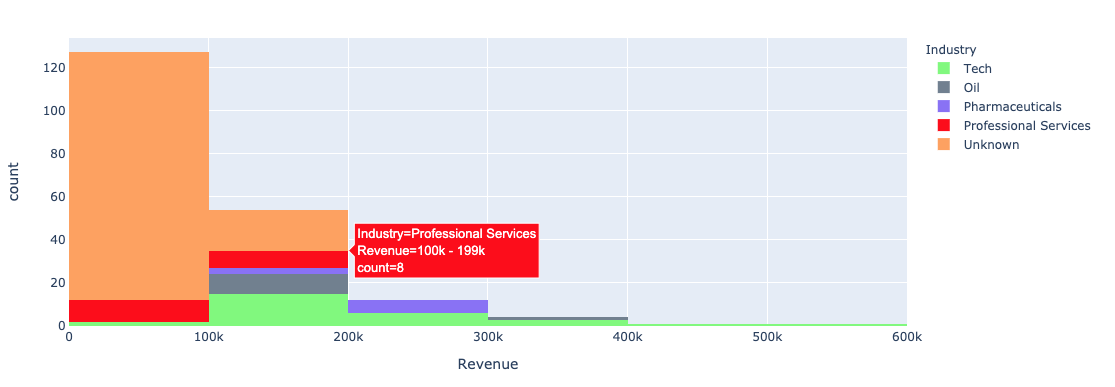
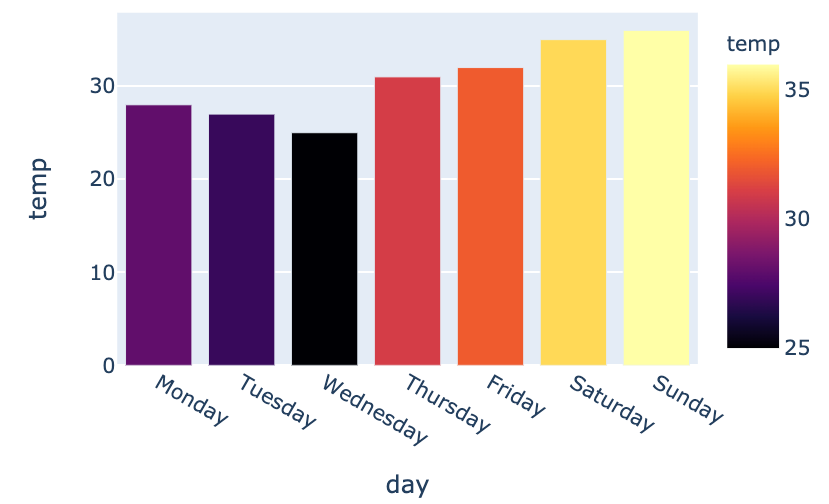
Color with univariate plots
Our specific colors
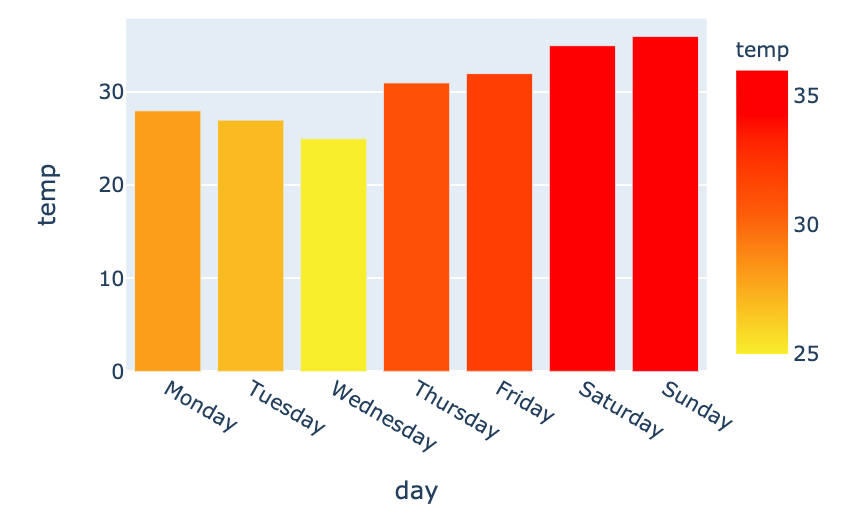
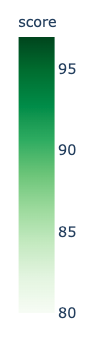
Color scales in plotly.express
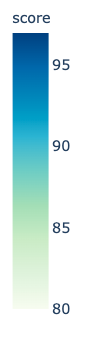
Using built-in color scales
Constructing our own color range