Bivariate visualizations
Introduction to Data Visualization with Plotly in Python

Alex Scriven
Data Scientist
scatterplot
- A y-axis representing one variable
- An x-axis representing a different variable
- Each intersection is a dot, e.g., (68, 472)
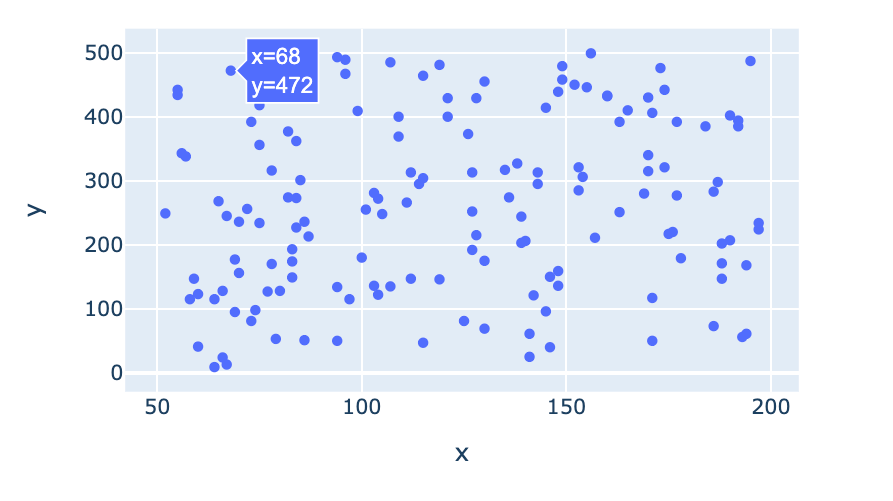
scatterplot with plotly.express
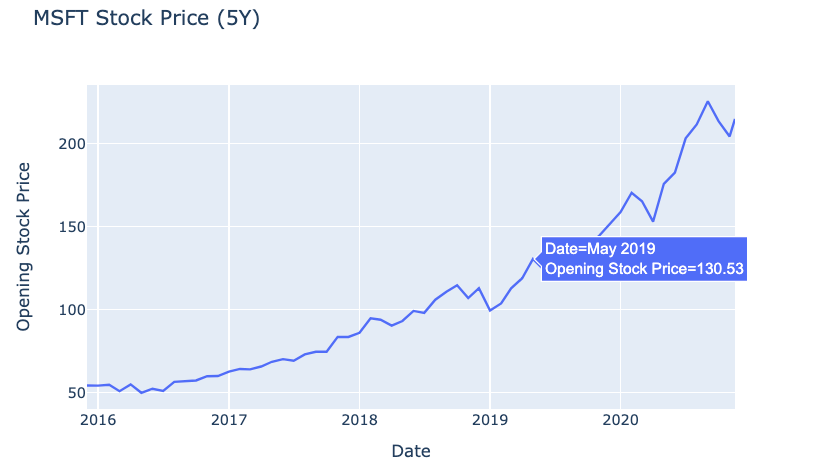
Line charts in plotly.express
$$
Correlation plot setup
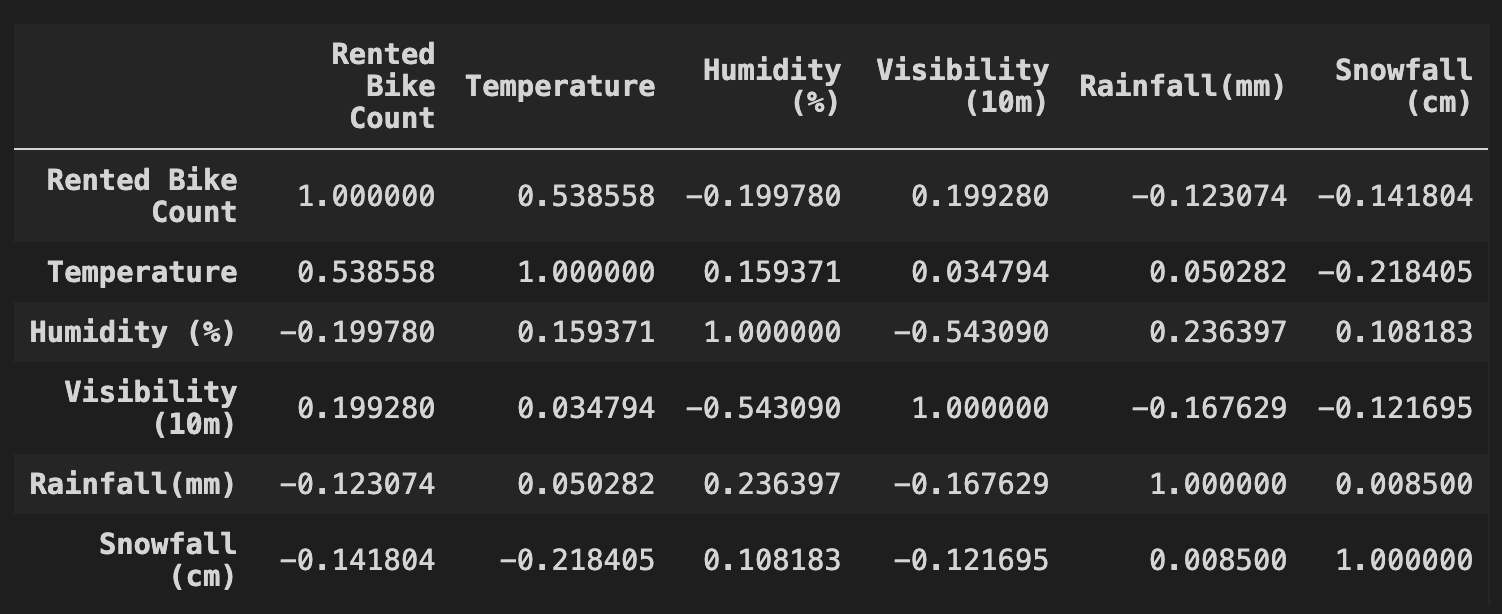
Our correlation plot