Custom buttons
Introduction to Data Visualization with Plotly in Python

Alex Scriven
Data Scientist
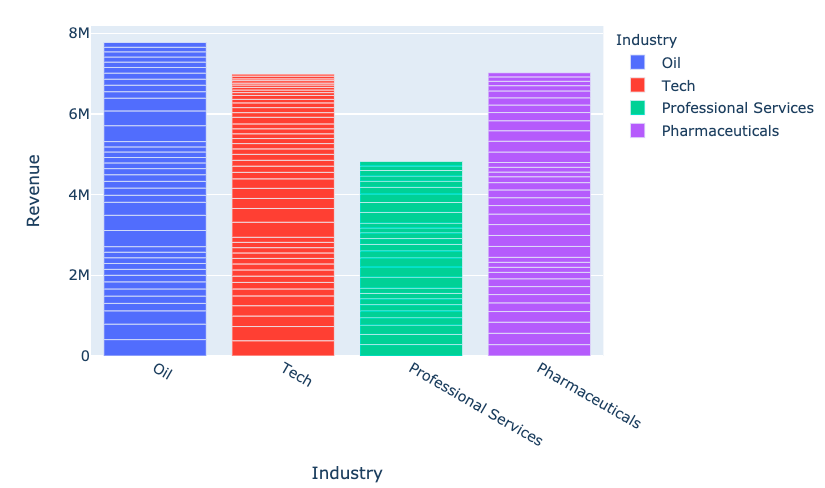
Plot type with buttons
The args argument
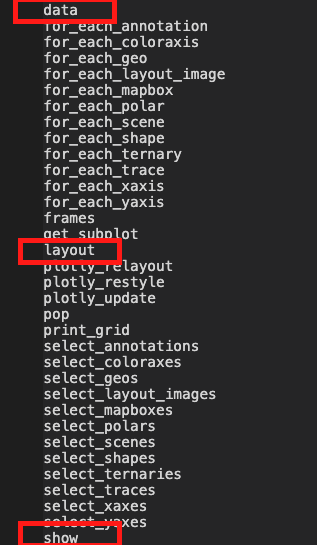
Using args for layout updates
dir(fig.layout)
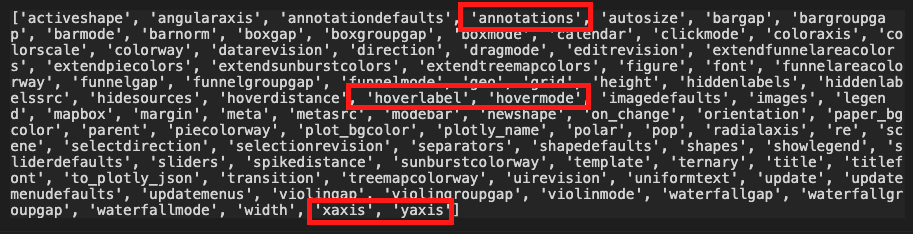
- Update any of the arguments with
'args'
Using args for data updates
dir(fig.data[0])
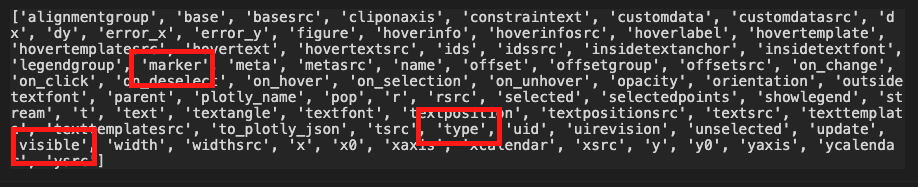
- Some are familiar, and some will be helpful later
Button interactivity
$$