Dropdowns
Introduction to Data Visualization with Plotly in Python

Alex Scriven
Data Scientist
What is a dropdown?
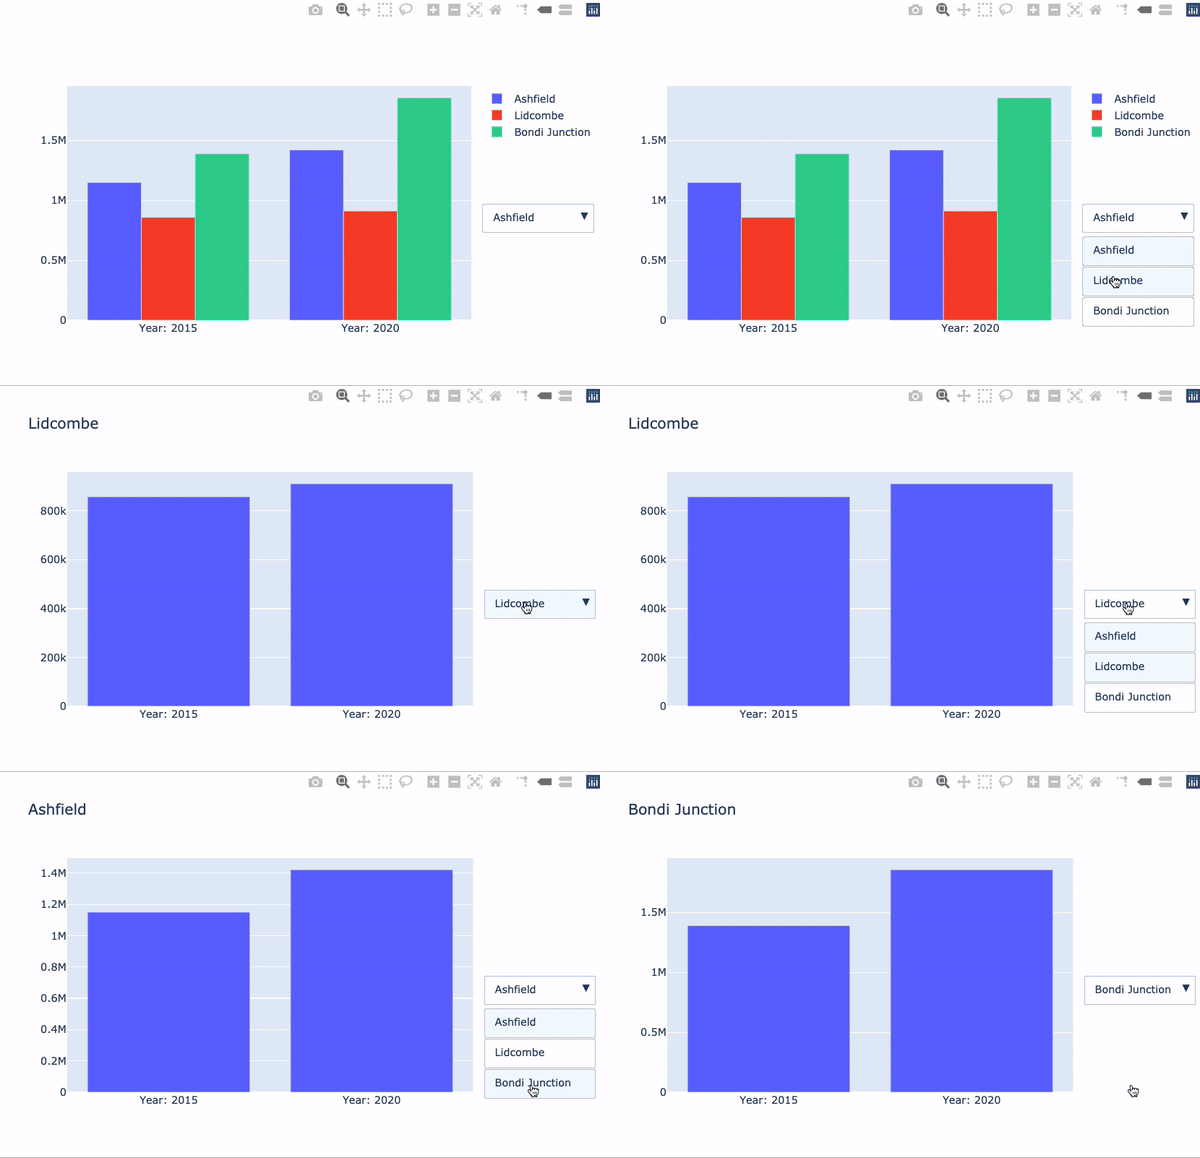
Allows the user to select from a set of options
Updates data or layout elements

Dropdowns in Plotly
$$
fig = go.Figure()for suburb in ['Ashfield', 'Lidcombe', 'Bondi Junction']: df = syd_houses[syd_houses.Suburb == suburb]fig.add_trace( px.bar(df, x='Year', y='Median House Price').data[0])
- Dropdowns work by showing and hiding specific traces
Hiding a trace
$$
- The
visibleargument determines whether traces are visible (True) or not (False) - Use
argsto update thevisibleargument of different traces
args:[{'visible': [True, False, False]}]

The dropdown object
# Create the dropdown dropdown_buttons = [ {'label': 'Ashfield', 'method': 'update','args': [{'visible': [True, False, False]}, {'title': 'Ashfield'}]},{'label': 'Lidcombe', 'method': 'update','args': [{'visible': [False, True, False]}, {'title': 'Lidcombe'}]},{'label': 'Bondi Junction', 'method': 'update','args': [{'visible': [False, False, True]}, {'title': 'Bondi Junction'}]}]
Adding the dropdown
$$
fig.update_layout({
  'updatemenus':[{
    'type': "dropdown",
    'x': 1.3,
    'y': 0.5,
    'showactive': True,
    'active': 0,
    'buttons': dropdown_buttons}]
})
fig.show()
$$

Let's practice!
Introduction to Data Visualization with Plotly in Python

