Mean reversion strategy

Financial Trading in Python

Chelsea Yang

Data Science Instructor

RSI-based mean reversion strategy

Buy the fear and sell the greed


  • RSI-based mean reversion strategy:
    • Short signal: RSI > 70
      • Suggests the asset is likely overbought and the price may soon reverse
    • Long signal: RSI < 30
      • Suggests the asset is likely oversold and the price may soon rally
Financial Trading in Python

Calculate the indicator

import talib
# Calculate the RSI
stock_rsi = talib.RSI(price_data['Close']).to_frame()
Financial Trading in Python

Construct the signal

# Create the same DataFrame structure as RSI
signal = stock_rsi.copy()
signal[stock_rsi.isnull()] = 0

# Construct the signal signal[stock_rsi < 30] = 1
signal[stock_rsi > 70] = -1
signal[(stock_rsi <= 70) & (stock_rsi >= 30)] = 0
Financial Trading in Python

Plot the signal

# Plot the RSI
stock_rsi.plot()
plt.title('RSI')

RSI plot

# Merge data into one DataFrame
combined_df = bt.merge(signal, stock_data)
combined_df.columns = ['Signal', 'Price']
# Plot the signal with price

combined_df.plot(secondary_y = ['Signal'])

RSI-based Signal plot

Financial Trading in Python

Define the strategy with the signal

# Define the strategy
bt_strategy = bt.Strategy('RSI_MeanReversion', 
                          [bt.algos.WeighTarget(signal),
                           bt.algos.Rebalance()])
Financial Trading in Python

Backtest the signal-based strategy

# Create the backtest and run it
bt_backtest = bt.Backtest(bt_strategy, price_data)
bt_result = bt.run(bt_backtest)
Financial Trading in Python

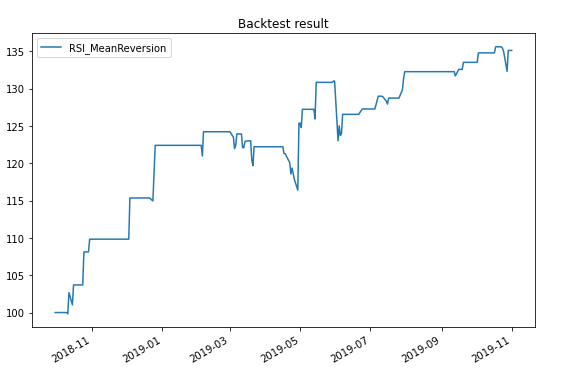
Plot backtest result

# Plot the backtest result
bt_result.plot(title='Backtest result')

RSI mean-reversion backtest result

Financial Trading in Python

Let's practice!

Financial Trading in Python

Preparing Video For Download...