Trend indicator MAs
Financial Trading in Python

Chelsea Yang
Data Science Instructor
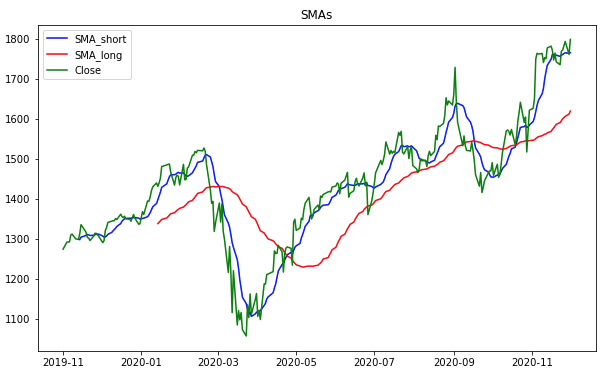
Plotting the SMA
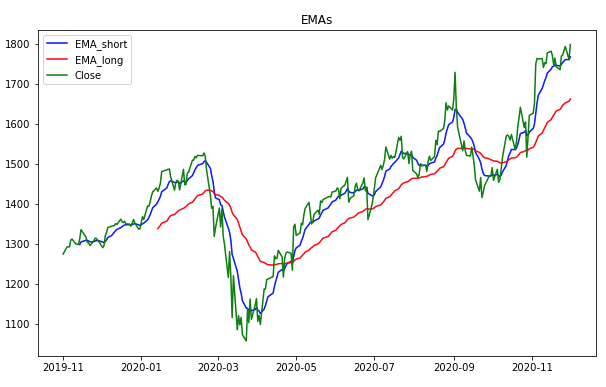
Plotting the EMA
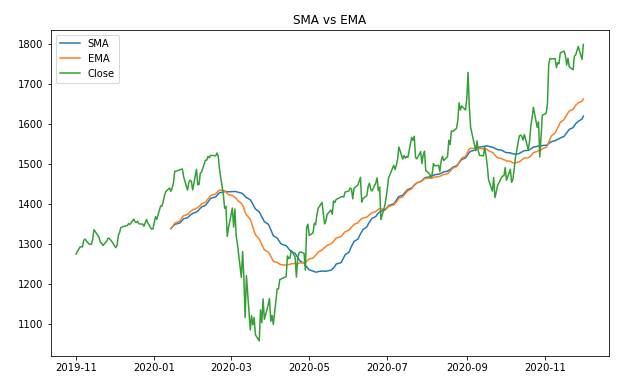
SMA vs. EMA
EMA is more sensitive to the most recent price movement
Financial Trading in Python
Chelsea Yang
Data Science Instructor
EMA is more sensitive to the most recent price movement

