Strategy return analysis
Financial Trading in Python

Chelsea Yang
Data Science Instructor
Obtain detailed backtest stats
# Get all backtest stats resInfo = bt_result.statsprint(resInfo.index)
Index(['start', 'end', 'rf', 'total_return', 'cagr', 'max_drawdown', 'calmar',
       'mtd', 'three_month', 'six_month', 'ytd', 'one_year', 'three_year',
       'five_year', 'ten_year', 'incep', 'daily_sharpe', 'daily_sortino',
       'daily_mean', 'daily_vol', 'daily_skew', 'daily_kurt', 'best_day',
       'worst_day', 'monthly_sharpe', 'monthly_sortino', 'monthly_mean',
       'monthly_vol', 'monthly_skew', 'monthly_kurt', 'best_month',
       'worst_month', 'yearly_sharpe', 'yearly_sortino', 'yearly_mean',
       'yearly_vol', 'yearly_skew', 'yearly_kurt', 'best_year', 'worst_year',
       'avg_drawdown', 'avg_drawdown_days', 'avg_up_month', 'avg_down_month',
       'win_year_perc', 'twelve_month_win_perc'],
      dtype='object')
Strategy returns
$ Return = (V_e - V_b)/ V_b $
$V_e$: ending value
$V_v$: beginning value
# Get daily, monthly and yearly returns
print('Daily return: %.4f'% resInfo.loc['daily_mean'])
print('Monthly return: %.4f'% resInfo.loc['monthly_mean'])
print('Yearly return: %.4f'% resInfo.loc['yearly_mean'])
Daily return: 0.1966
Monthly return: 0.2207
Yearly return: 0.3328
Compound annual growth rate
$ CAGR = (V_f / V_i)^\frac{1}{n} -1 $
$V_f$: final value
$V_i$: initial value
$n$: number of years
# Get the compound annual growth rate
print('Compound annual growth rate: %.4f'% resInfo.loc['cagr'])
Compound annual growth rate: 0.1855
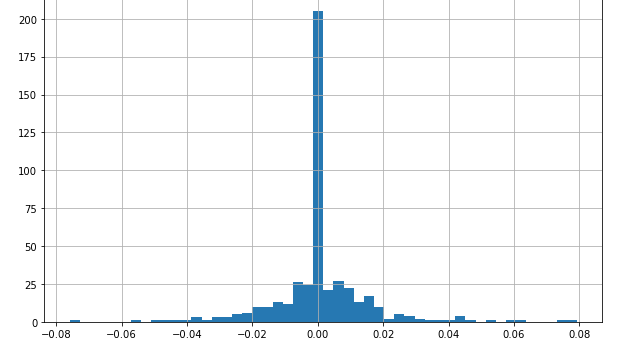
Plot return histogram
# Plot the weekly return histogram
bt_result.plot_histograms(bins=50, freq = 'w')

Compare strategy lookback returns
# Get the lookback returns
lookback_returns = bt_result.display_lookback_returns()
print(lookback_returns)
      Strategy1 Strategy2
mtd       3.30%    -0.03%
3m        0.68%    -2.15%
6m        8.11%     8.32%
ytd      28.08%    10.46%
1y       35.20%    17.09%
3y       11.48%    11.01%
5y        9.35%     9.48%
10y       9.35%     9.48%
incep     9.35%     9.48%
Let's practice!
Financial Trading in Python

