Getting familiar with your trading data
Financial Trading in Python

Chelsea Yang
Data Science Instructor
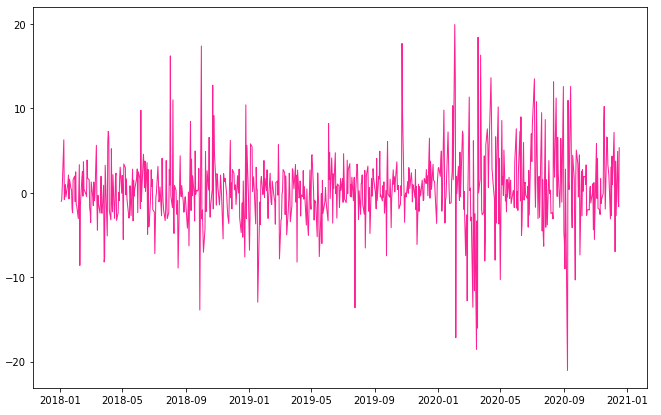
Calculate daily returns
# Plot the data
plt.plot(stock_data['daily_return'])
plt.show()
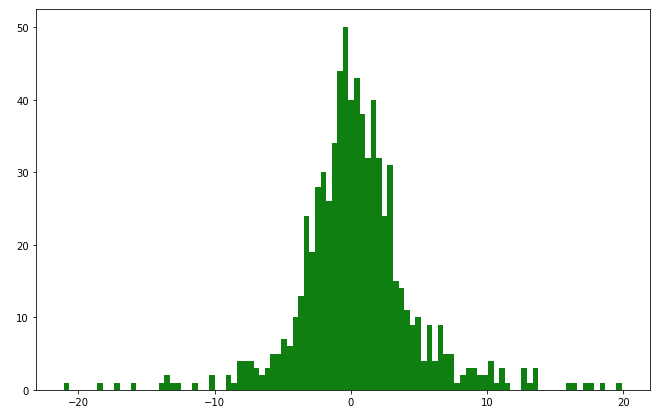
Plot a histogram of daily returns
stock_data['daily_return'].hist(bins=100)
plt.show()
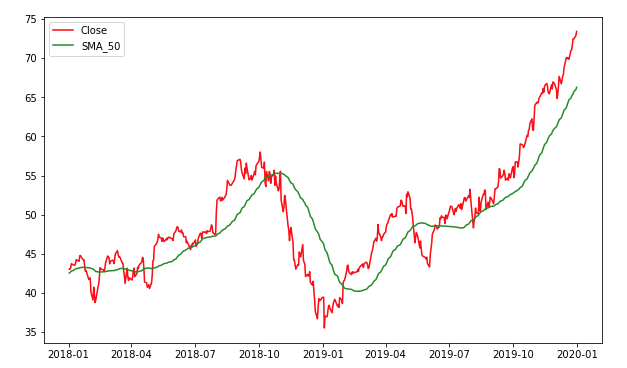
Plot the rolling average