What is financial trading
Financial Trading in Python

Chelsea Yang
Data Science Instructor
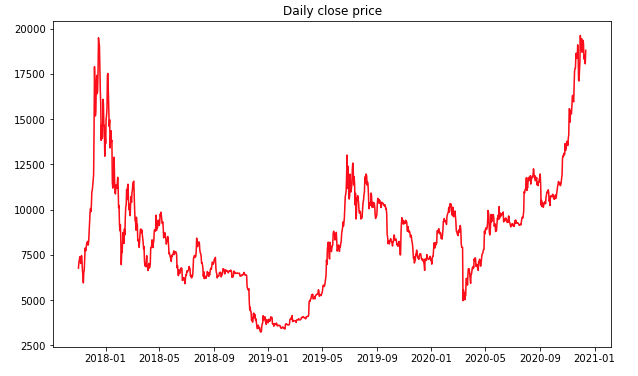
Plot line chart of time series data
import matplotlib.pyplot as plt
plt.plot(bitcoin_data['Close'], color='red')
plt.title("Daily close price")
plt.show()
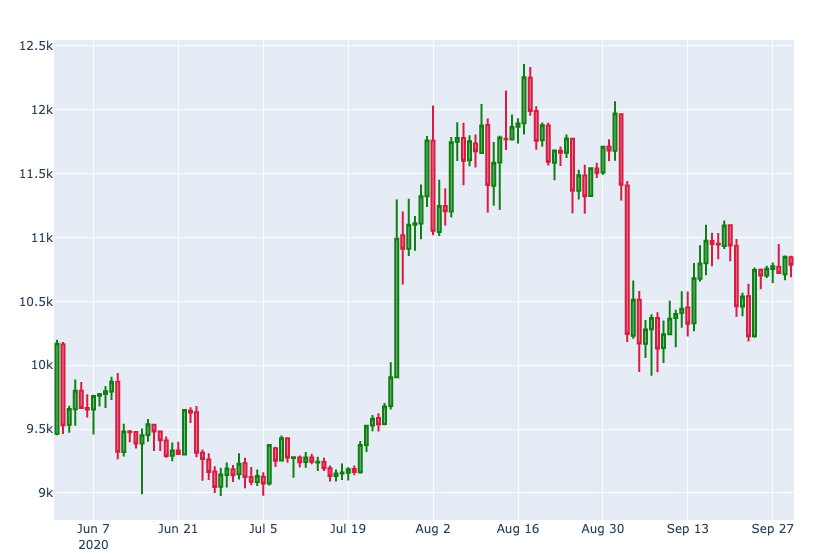
Candlestick chart
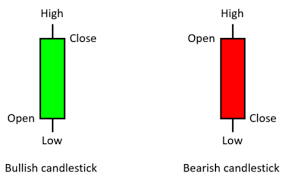
Each candlestick displays high, low, open, and close
The color indicates bullish (rising prices) or bearish (falling prices) movement
Plot candlestick chart with Python