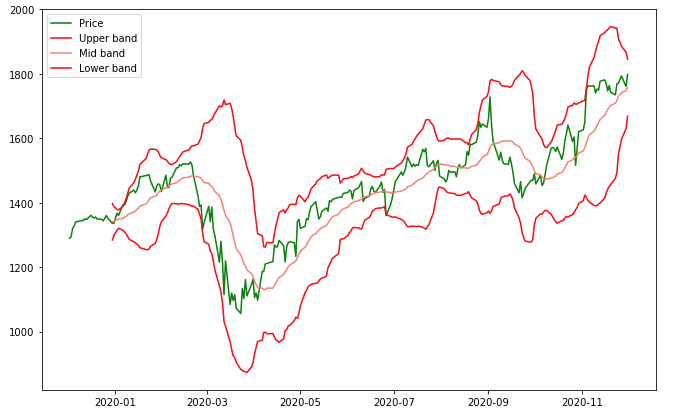
Volatility indicator: Bollinger Bands
Financial Trading in Python

Chelsea Yang
Data Science Instructor
What are Bollinger Bands?
Developed by John Bollinger
- "Bollinger on Bollinger Bands"

- Measure price volatility
- Composed of three lines:
- Middle band: n-period simple moving average
- Upper band: k-standard deviations above the middle band
- Lower band: k-standard deviations below the middle band
Bollinger Bands implications
- The wider the bands, the more volatile the asset prices.
- Measure whether a price is too high or too low on a relative basis:
- Relatively high: price close to the upper band
- Relatively low: price close to the lower band
Implementing Bollinger Bands in Python
# Define the Bollinger Bands
upper, mid, lower = talib.BBANDS(stock_data['Close'],
                                 nbdevup=2,
                                 nbdevdn=2,
                                 timeperiod=20)
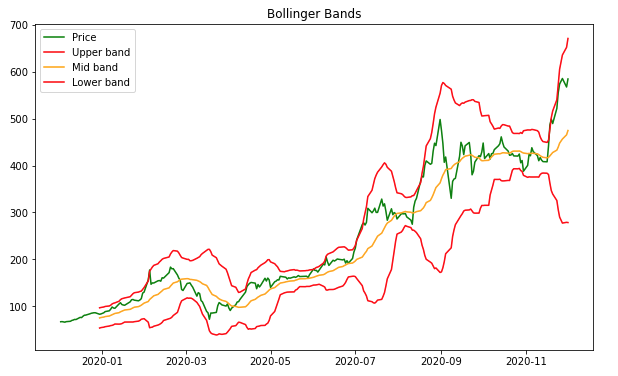
Plotting Bollinger Bands
import matplotlib.pyplot as plt # Plot the Bollinger Bands plt.plot(stock_data['Close'], label='Price') plt.plot(upper, label="Upper band") plt.plot(mid, label='Middle band') plt.plot(lower, label='Lower band')# Customize and show the plot plt.title('Bollinger Bands') plt.legend() plt.show()

Let's practice!
Financial Trading in Python

