Seaborn bar plots
Working with Categorical Data in Python

Kasey Jones
Research Data Scientist
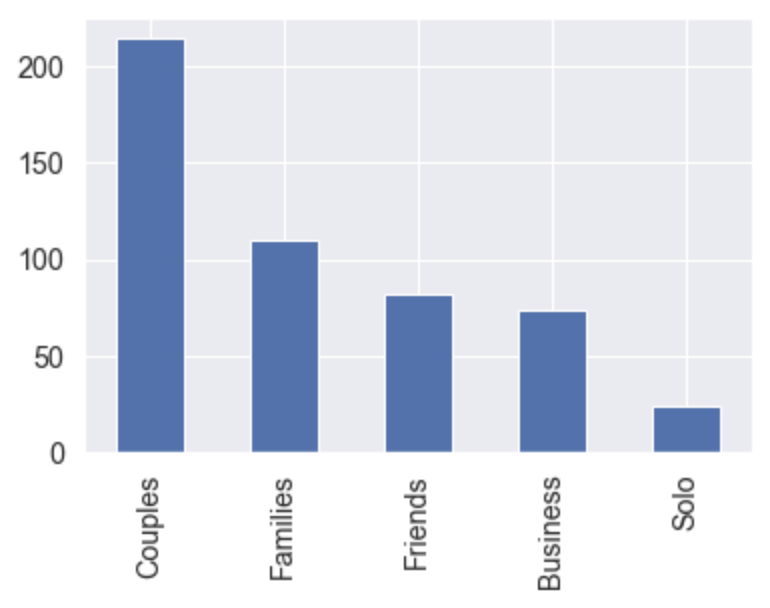
Traditional bar chart
# Code provided for clarity
reviews["Traveler type"].value_counts().plot.bar()
The syntax
sns.set(font_scale=1.3) sns.set_style("darkgrid")sns.catplot(x="Traveler type", y="Score", data=reviews, kind="bar")
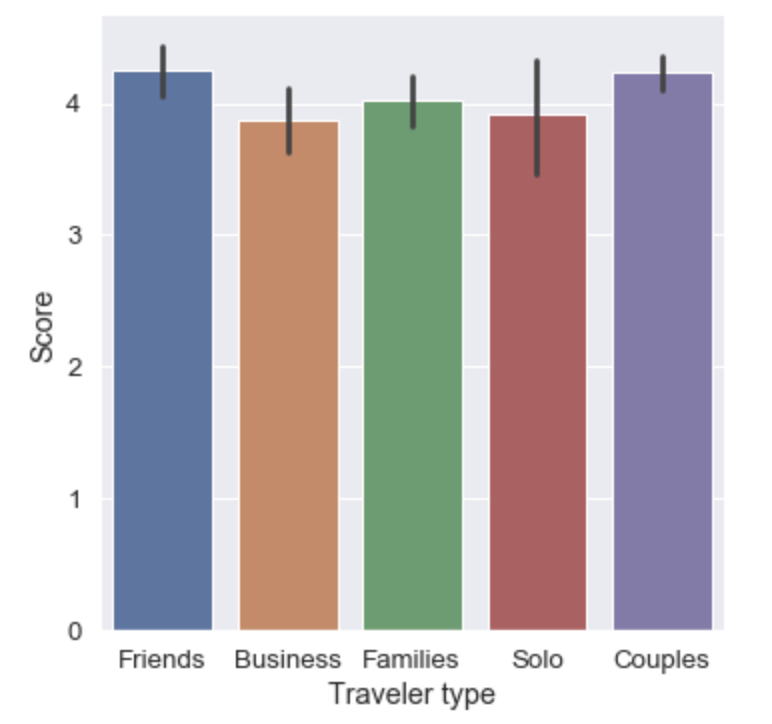
Updated visualization
sns.catplot(x="Traveler type", y="Score", data=reviews, kind="bar")
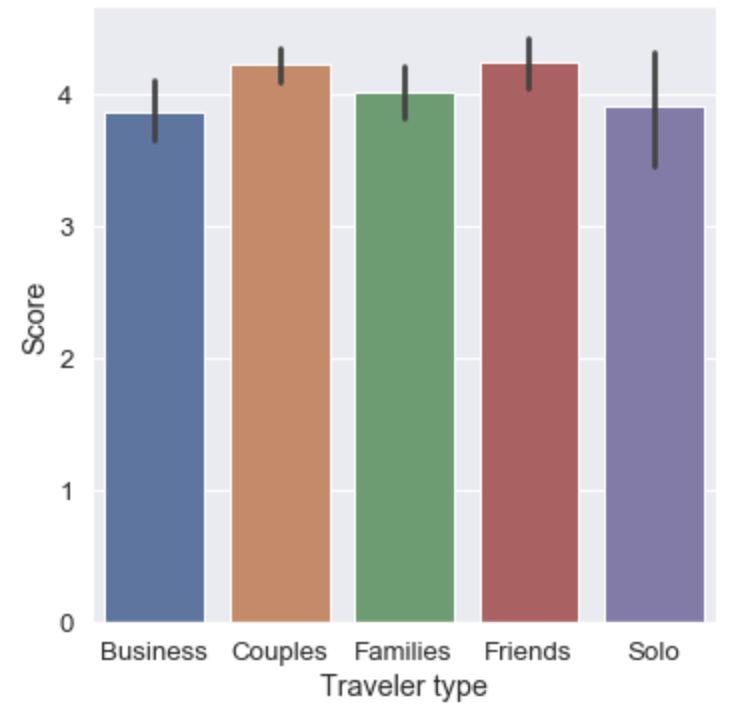
- Note:
catplot()has anorderparameter
Bar plot across two variables


