Anonymizing categorical data
Data Privacy and Anonymization in Python

Rebeca Gonzalez
Instructor
Generalization
    Age    Gender    Department    Condition
0    30    F         Finance       Anxiety disorders
1    42    M         Production    Bronchitis
2    35    F         Marketing     Dysthymia
3    39    F         Production    Dysthymia
4    40    M         Marketing     Flu
    Age    Gender    Department    Condition
0    <40   F         Finance       Anxiety disorders
1    >=40  M         Production    Bronquitis
2    <40   F         Finance       Dysthymia
3    <40   F         Production    Dysthymia
4    >=40  M         Marketing     Flu
Generalization of categorical data
# See the dataset
hr.head()
    Age    BusinessTravel        Department                EducationField    EmployeeNumber
0    41    Travel_Rarely         Sales                     Life Sciences     1
1    49    Travel_Frequently     Research & Development    Life Sciences     2
2    37    Travel_Rarely         Research & Development    Other             4
3    33    Travel_Frequently     Research & Development    Life Sciences     5
4    27    Travel_Rarely         Research & Development    Medical           7
Categorical data
Limited or fixed number of possible values.
- race
- gender
- hometown
- age group
- educational level
- movies they like and preferences
Anonymizing categorical data

Anonymizing categorical data
     Department                EducationField
0    Sales                     Life Sciences
1    Research & Development    Life Sciences
2    Research & Development    Other
3    Research & Development    Life Sciences
4    Research & Development    Medical
Original dataset
     Department                EducationField
0    Sales                     Medical
1    Research & Development    Marketing
2    Research & Development    Life Sciences
3    Research & Development    Other
4    Research & Development    Life Sciences
Resulting dataset after sampling from the probability distribution of the educationField column in the original dataset.
Sample from data
The U.S. Census publicly releases samples of data that they collect about citizens.
Enable calculation of large-scale statistical patterns:
- averages
- variances
- clusters
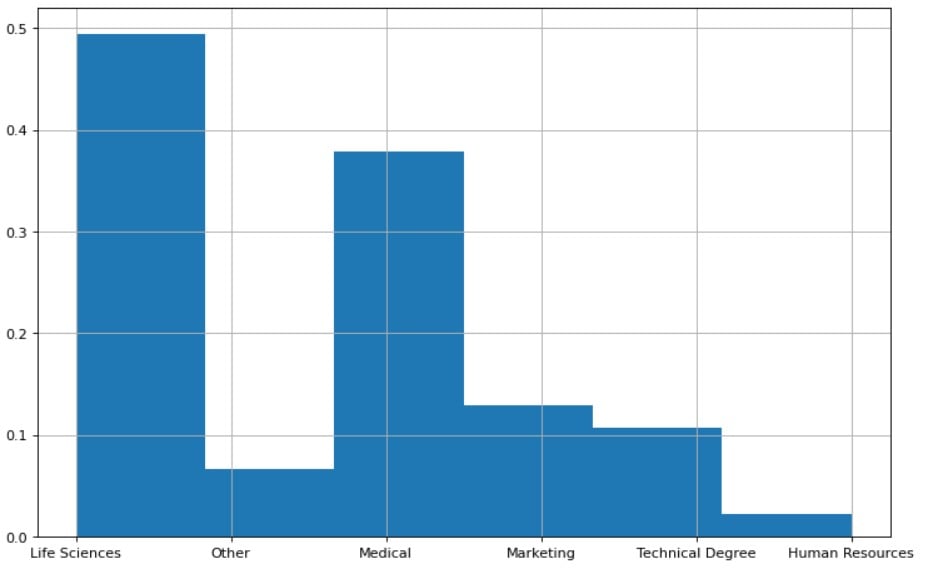
Explore the distribution
# Show the absolute frequencies of each unique value
hr['EducationField'].value_counts()
Life Sciences       606
Medical             464
Marketing           159
Technical Degree    132
Other                82
Human Resources      27
Name: EducationField, dtype: int64
Explore the distribution
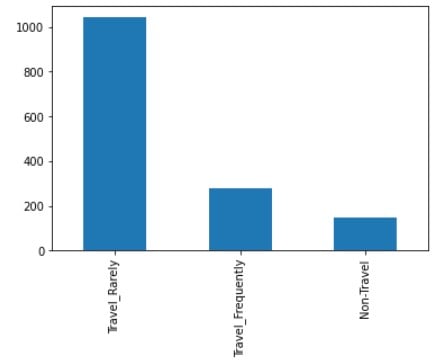
# Generate a bar plot for the categories
df['BusinessTravel'].value_counts().plot(kind='bar')

Explore the distribution
# Obtain the absolute frequencies of each unique value
counts = hr['EducationField'].value_counts()

# Print the list of indexes
print(counts.index)
Index(['Life Sciences', 'Medical', 'Marketing',
      'Technical Degree', 'Other', 'Human Resources'],
       dtype='object')
Explore the distribution
# Probability distributions of each unique value
counts = df['EducationField'].value_counts(normalize=True)
Life Sciences       0.412245
Medical             0.315646
Marketing           0.108163
Technical Degree    0.089796
Other               0.055782
Human Resources     0.018367
Name: EducationField, dtype: float64
Explore the distribution
# Values of the frequencies of each unique value
df['EducationField'].value_counts(normalize=True).values
array([0.4122449 , 0.31564626, 0.10816327, 0.08979592, 0.05578231,
       0.01836735])
Sampling from the same distribution
# Sample from a probability distribution hr_sample['EducationField']= np.random.choice(counts.index, p=counts.values, size=len(hr))# See resulting dataset hr.head()
    Age    BusinessTravel        Department                EducationField    EmployeeNumber
0    41    Travel_Rarely         Sales                     Life Sciences     1
1    49    Travel_Frequently     Research & Development    Medical           2
2    37    Travel_Rarely         Research & Development    Marketing         4
3    33    Travel_Frequently     Research & Development    Technical Degree  5
4    27    Travel_Rarely         Research & Development    Medical           7
Sampling from the same distribution
# Show the absolute frequencies of each category
hr['EducationField'].value_counts()
Life Sciences       606
Medical             464
Marketing           159
Technical Degree    132
Other                82
Human Resources      27
Name: EducationField, dtype: int64
# Show the frequencies of the resulting column
hr_sample['EducationField'].value_counts()
Life Sciences       604
Medical             493
Marketing           158
Technical Degree    120
Other                61
Human Resources      34
Name: EducationField, dtype: int64
Let's practice!
Data Privacy and Anonymization in Python

