Numeric predictors
Modeling with tidymodels in R

David Svancer
Data Scientist
Correlated predictor variables
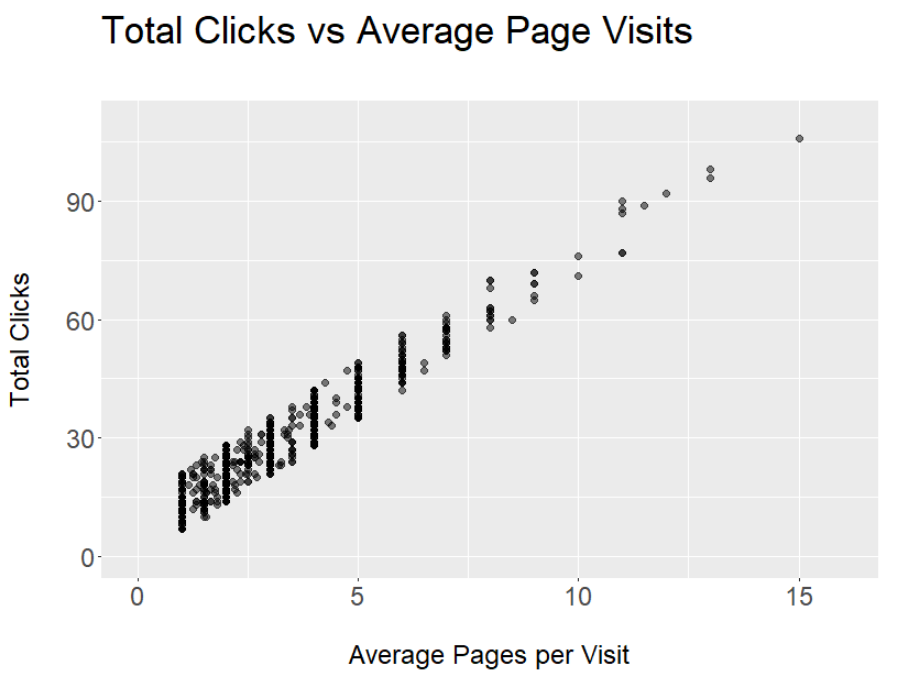
Correlation measures the strength of a linear relationship between two numeric variables
- Ranges from -1 to 1
Highly correlated predictors near -1 or 1
- Provide redundant information
- Model fitting problems (multicollinearity)
ggplot(leads_training,
       aes(x = pages_per_visit, y = total_clicks)) +
  geom_point()  +
  labs(title = 'Total Clicks vs Average Page Visits',
       y = 'Total Clicks', x = 'Average Pages per Visit')
Finding correlated predictor variables
Calculate a correlation matrix
- Pass dataset to
select_if()function- Provide
is.numericas argument
- Provide
- Pass to
cor()function
leads_training %>%select_if(is.numeric) %>%cor()
              total_visits total_time pages_per_visit total_clicks
total_visits        1.00       0.01            0.43         0.42
total_time          0.01       1.00            0.02         0.01
pages_per_visit     0.43       0.02            1.00         0.96
total_clicks        0.42       0.01            0.96         1.00
Processing correlated predictors
Removing multicollinearity with recipes
- Specify
recipeobject withrecipe()function - Pass to
step_corr()- Add all numeric columns
- Column names separated by commas
- Provide correlation
threshold- Absolute value
- Threshold of 0.9 removes correlations at 0.9 or more and -0.9 or less
- Add all numeric columns
leads_cor_rec <- recipe(purchased ~ ., data = leads_training) %>%step_corr(total_visits, total_time, pages_per_visit, total_clicks, threshold = 0.9)leads_cor_rec
Data Recipe
Inputs:
      role #variables
   outcome          1
 predictor          6

Operations:
Correlation filter on total_visits,..., total_clicks
Selecting predictors by type
all_outcomes()- Selects the outcome variable
all_numeric()- Selects all numeric variables
- Will include the outcome variable if it is numeric
- Selects all numeric variables
To select numeric predictors for recipe steps
- Pass
all_numeric()tostep_*()functions - If outcome variable is numeric, also pass
-all_outcomes()
leads_cor_rec <- recipe(purchased ~ ., data = leads_training) %>%step_corr(all_numeric(), threshold = 0.9)leads_cor_rec
Data Recipe
Inputs:
      role #variables
   outcome          1
 predictor          6

Operations:
Correlation filter on all_numeric()
Training and applying the recipe
- Train with
prep()- Provide
leads_trainingfor training
- Provide
- Apply with
bake()pages_per_visitremoved fromleads_testpages_per_visitwill be removed from all future data as well
leads_cor_rec %>%prep(training = leads_training) %>%bake(new_data = leads_test)
# A tibble: 332 x 6
total_visits total_time total_clicks ... purchased
    <dbl>       <dbl>        <dbl>   ...   <fct>
 1   8          100           24     ...    no
 2   4          1346          22     ...    yes
 3   3          176           27     ...    no
 4   2          16            12     ...    no
 5   9          1022          12     ...    yes
# ... with 327 more rows
Normalization
Centering and scaling numeric variables
- Subtract the mean
- Divide by the standard deviation
- Transforms data to standard deviation units
- Transformed variable will have a mean of 0 and standard deviation of 1
The total_time variable in leads_training
- Spending 1,273 seconds on the website is 1.19 standard deviations greater than the average time spent by customers

Combining data preprocessing steps
Normalizing numeric predictors with recipes
step_normalize()- Column names or
all_numeric()selector - Means and standard deviations from training data columns applied to new data sources
- Column names or
Multiple step_*() functions can be added to a recipe
- Order matters
leads_norm_rec <- recipe(purchased ~ ., data = leads_training) %>%step_corr(all_numeric(), threshold = 0.9) %>% step_normalize(all_numeric())leads_norm_rec
Data Recipe
Inputs:
      role #variables
   outcome          1
 predictor          6

Operations:
Correlation filter on all_numeric()
Centering and scaling for all_numeric()
Transforming the test data
pages_per_vist is removed and numeric predictors are normalized
leads_norm_rec %>%
  prep(training = leads_training) %>%
  bake(new_data = leads_test)
# A tibble: 332 x 6
 total_visits  total_time  total_clicks  lead_source   us_location  purchased
      <dbl>      <dbl>        <dbl>        <fct>          <fct>      <fct>
 1    0.864     -0.984     -0.360        direct_traffic   west        no
 2   -0.151      1.33      -0.506        direct_traffic   northeast   yes
 3   -0.405     -0.843     -0.140        organic_search   west        no
 4   -0.659     -1.14      -1.24         email            midwest     no
 5    1.12       0.725     -1.24         direct_traffic   west        yes
# ... with 327 more rows
Let's practice!
Modeling with tidymodels in R

