Estimating performance with cross validation
Modeling with tidymodels in R

David Svancer
Data Scientist
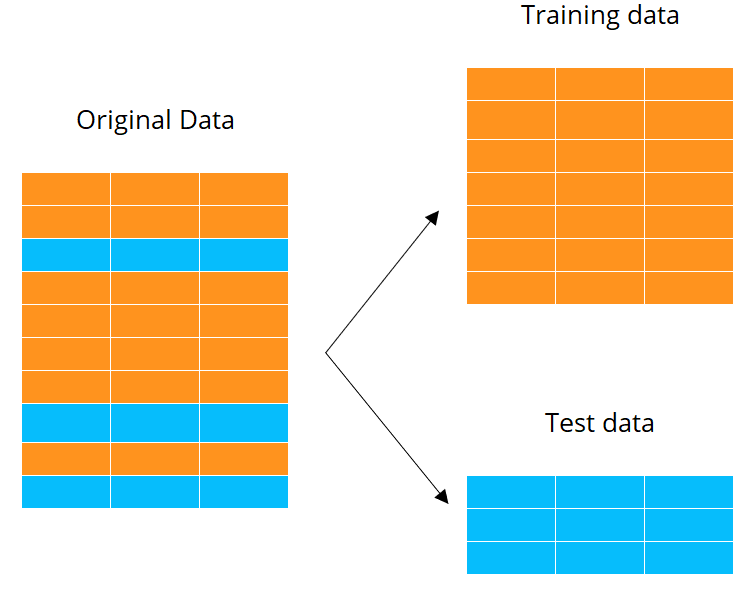
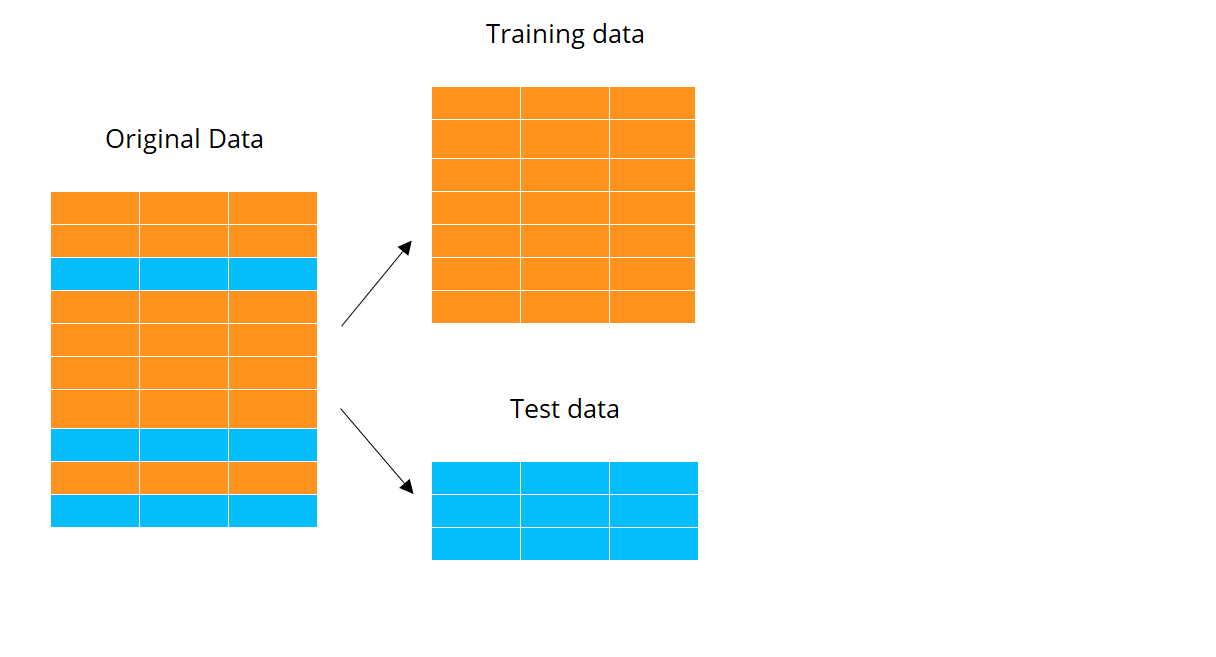
Training and test datasets
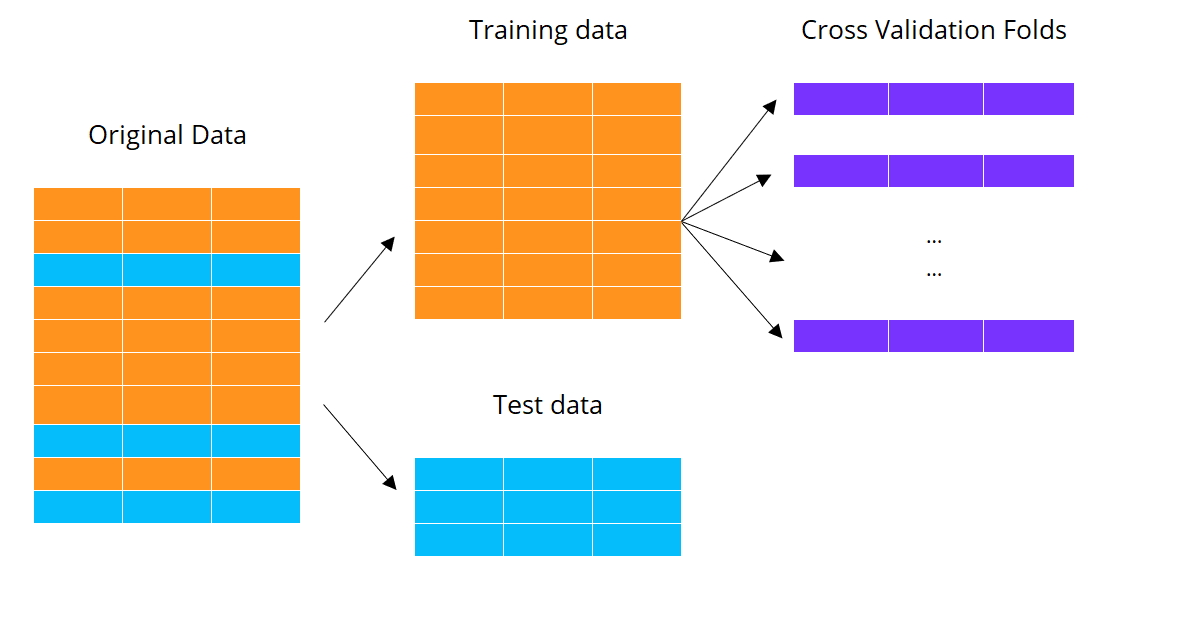
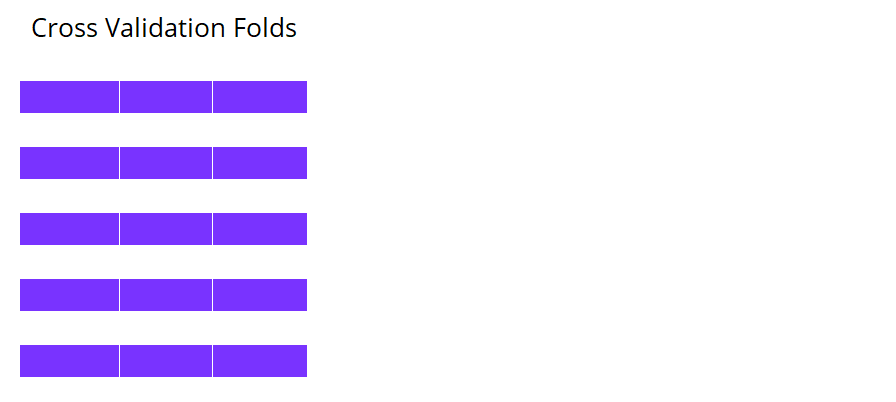
K-fold cross validation
K-fold cross validation
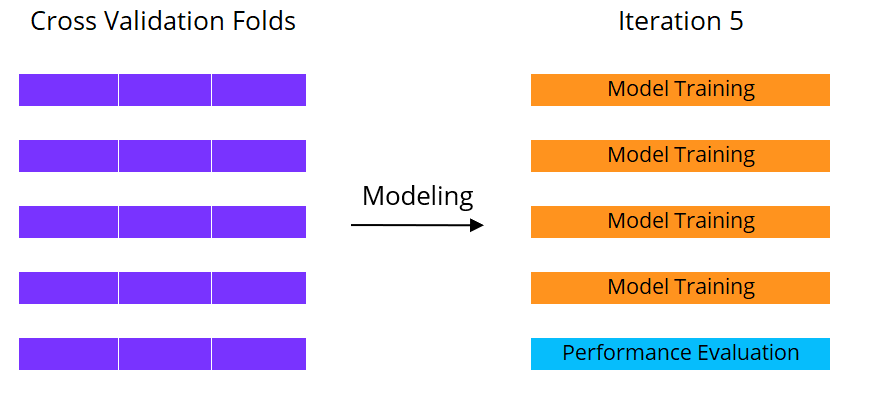
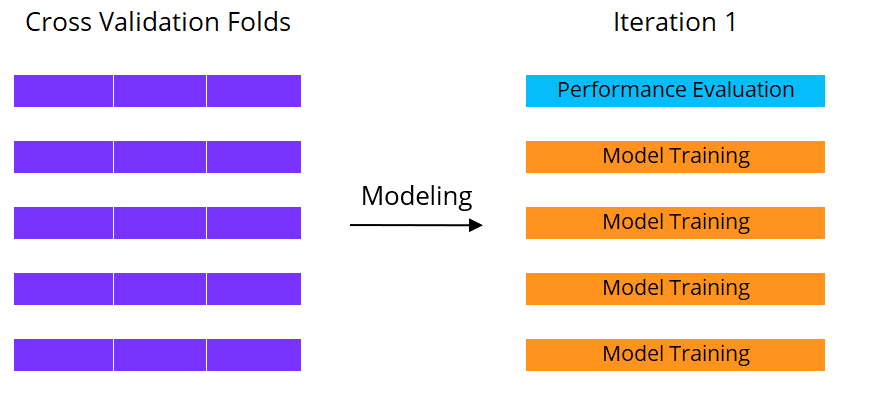
Machine learning with cross validation
Machine learning with cross validation
Machine learning with cross validation
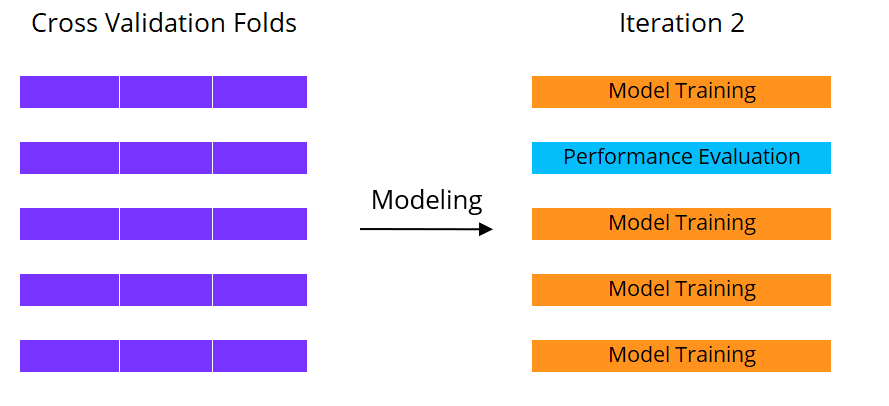
Machine learning with cross validation