Machine learning workflows
Modeling with tidymodels in R

David Svancer
Data Scientist
Classification with decision trees
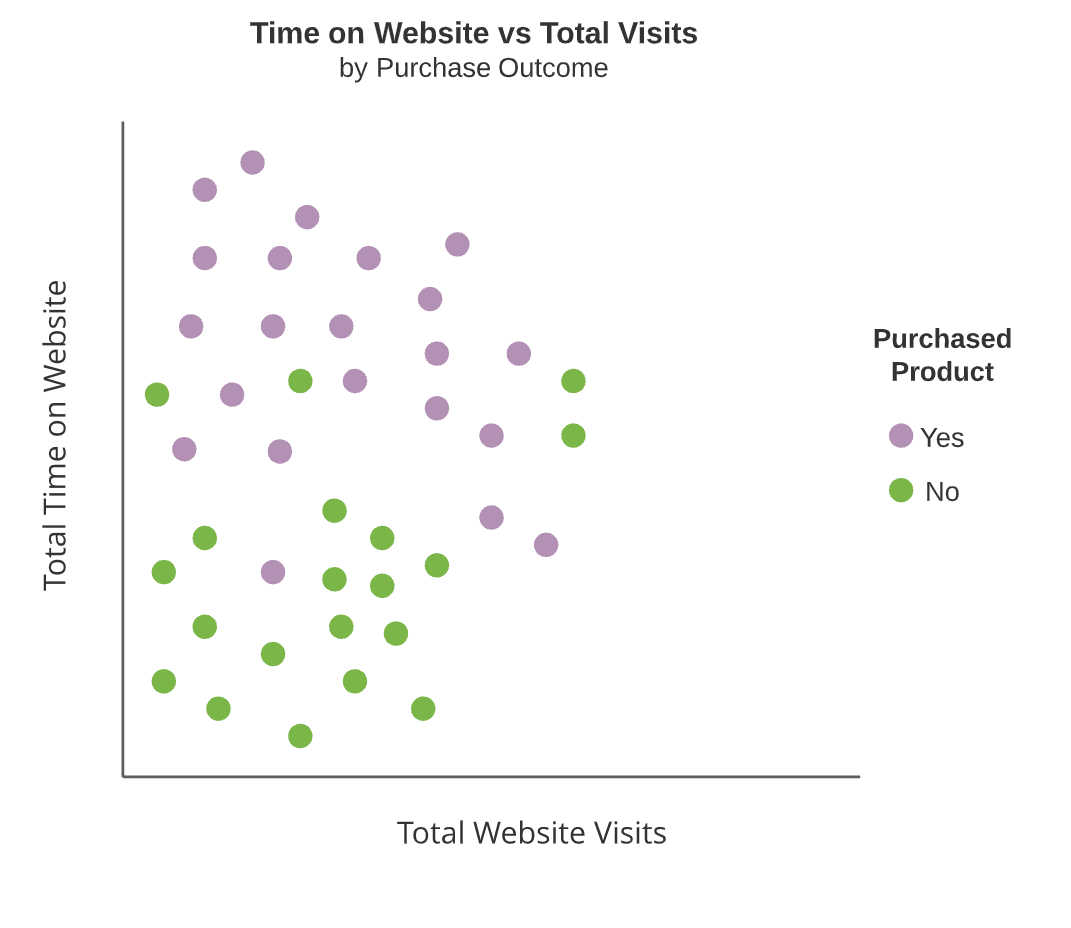
Classification with decision trees
Classification with decision trees

Classification with decision trees
Classification with decision trees
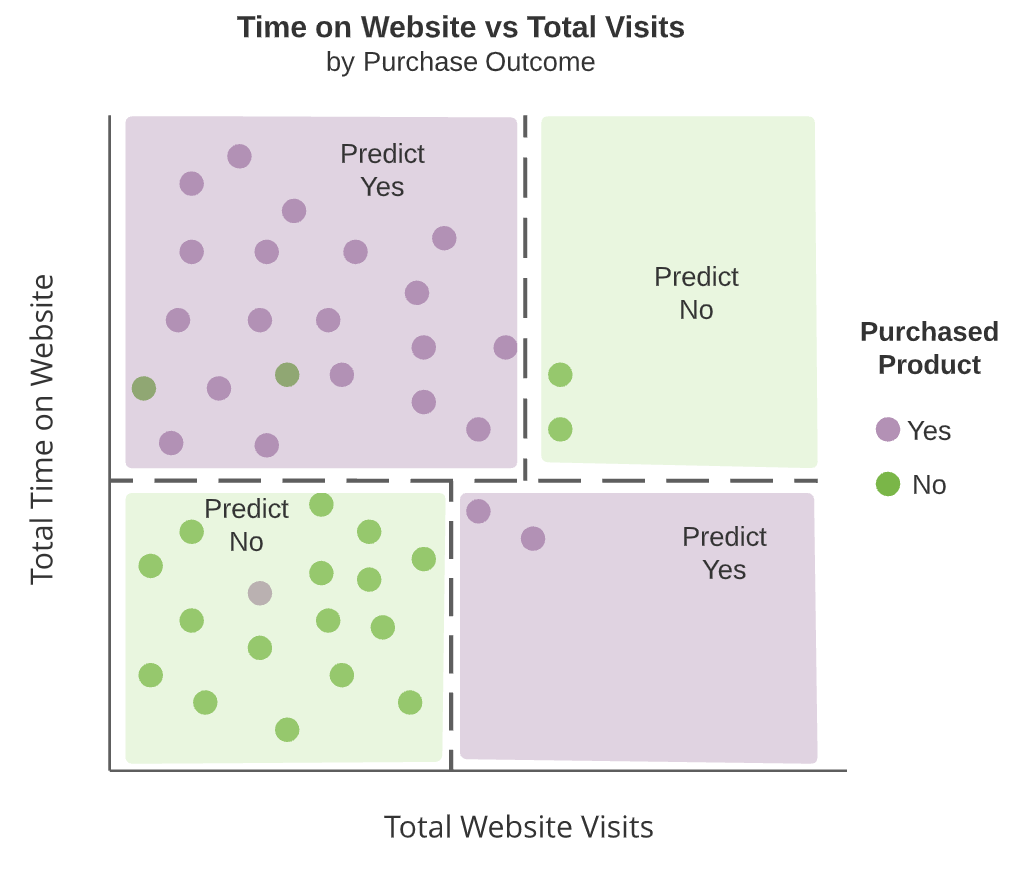
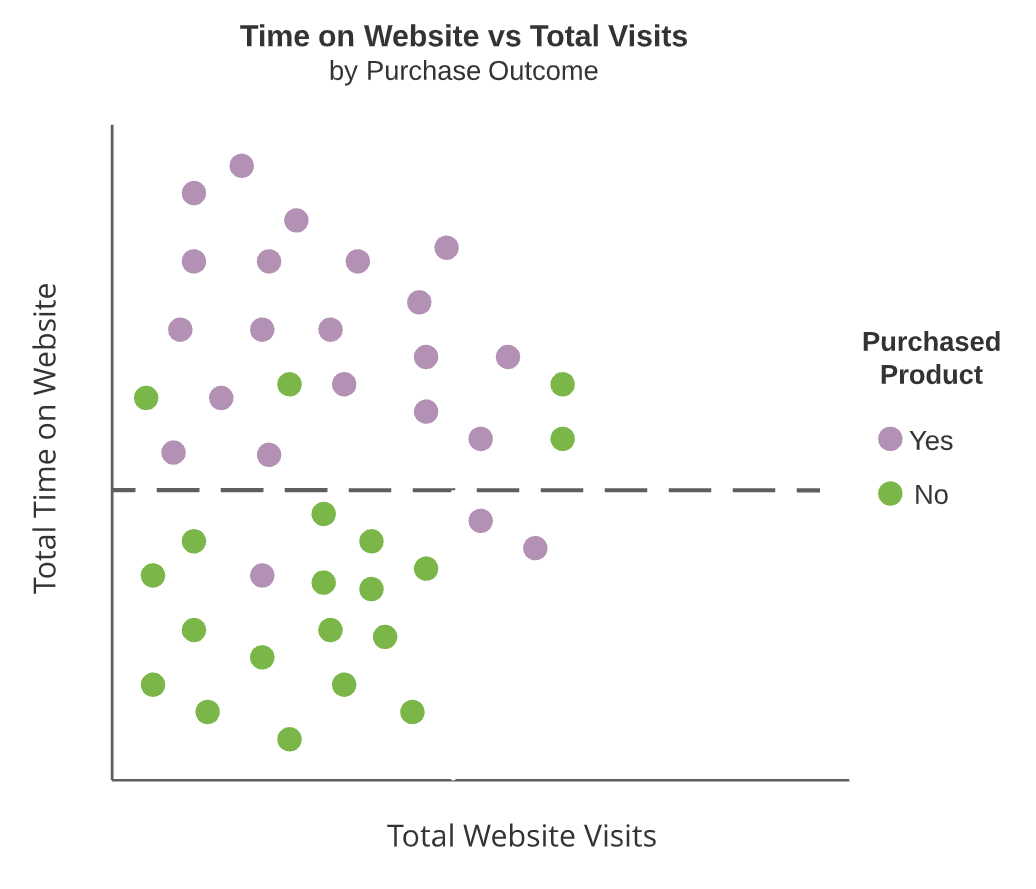
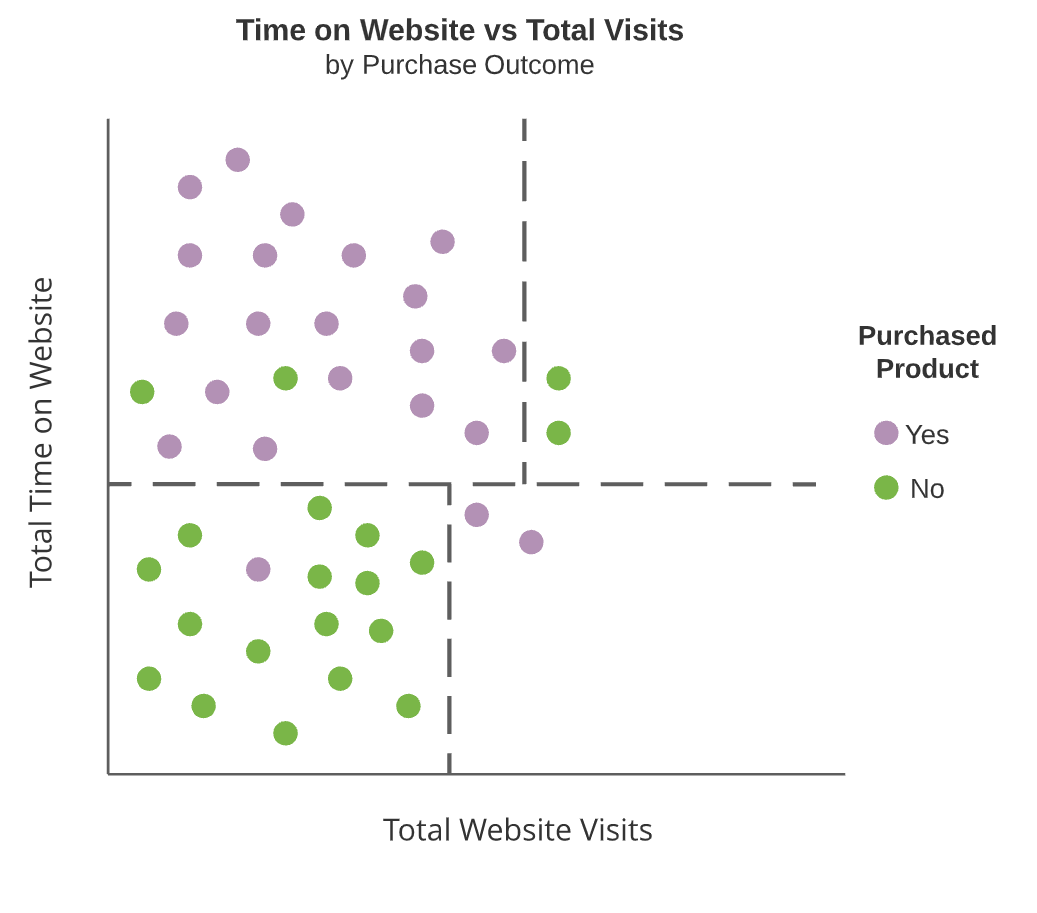
Tree diagrams
- Interior nodes
- Decision tree splits (dark boxes)
- Terminal nodes
- Regions which are not split further
- Green and purple boxes
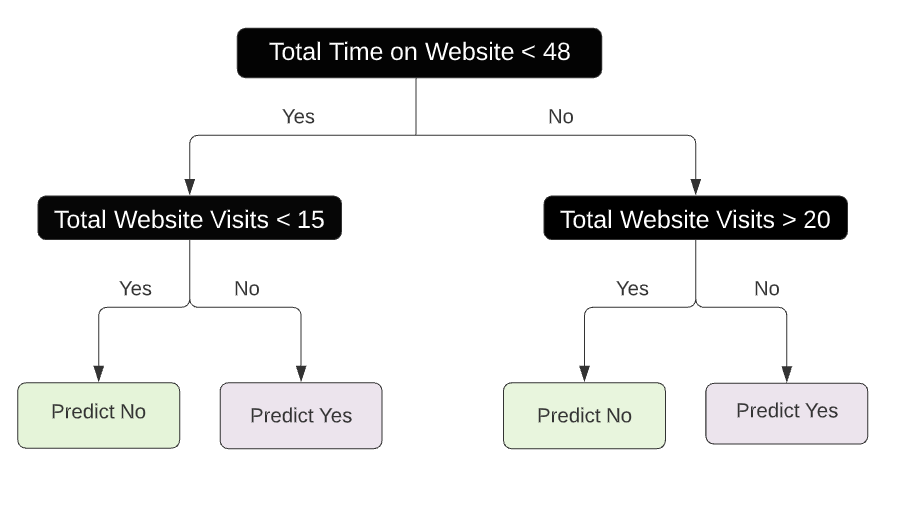
Interior nodes are dashed lines and terminal nodes are highlighted rectangular regions

