Assessing model fit
Modeling with tidymodels in R

David Svancer
Data Scientist
Binary classification
Outcome variable with two levels
- Positive class
- Event of interest to predict
- "yes" in
purchasedvariable
Negative class
- "no"
In
tidymodelsoutcome variable needs to be a factor- First level is positive class
- Check order with
levels()
leads_df
# A tibble: 1,328 x 7
  purchased total_visits  ...   us_location
   <fct>        <dbl>     ...     <fct>
 1 yes            7       ...     west
 2 no             8       ...     west
 3 no             5       ...     southeast
# ... with 1,325 more rows
levels(leads_df[['purchased']])
[1] "yes" "no"
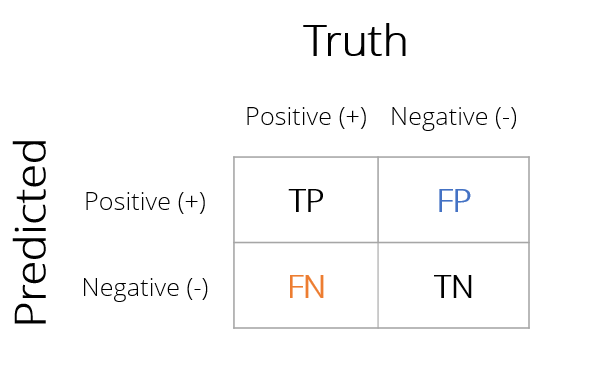
Confusion matrix
Matrix with counts of all combinations of actual and predicted outcome values
Correct Predictions
- True Positive (TP)
- True Negative (TN)
Classification Errors
- False Positive (FP)
- False Negative (FN)
Classification metrics with yardstick
Creating confusion matrices and other model fit metrics with yardstick
- Requires a tibble of model results which contain:
- True outcome values
purchased
- Predicted outcome categories
.pred_class
- Estimated probabilities of each category
.pred_yes.pred_no
- True outcome values
leads_results
# A tibble: 332 x 4
   purchased .pred_class .pred_yes .pred_no
   <fct>     <fct>           <dbl>    <dbl>
 1 no        no             0.134     0.866
 2 yes       yes            0.729     0.271
 3 no        no             0.133     0.867
 4 no        no             0.0916    0.908
 5 yes       yes            0.598     0.402
 6 no        no             0.128     0.872
 7 yes       no             0.112     0.888
 8 no        no             0.169     0.831
 9 no        no             0.158     0.842
10 yes       yes            0.520     0.480
# ... with 322 more rows
Confusion matrix with yardstick
The conf_mat() function
- Tibble of model results
truth- column with true outcomesestimate- column with predicted outcomes
Logistic regression on leads_df
- Correctly classified 252 out of 332 customers (76%)
- 46 false negatives
- 34 false positives
conf_mat(leads_results,truth = purchased,estimate = .pred_class)
Truth
Prediction yes no
yes 74 34
no 46 178
Classification accuracy
The accuracy() function
- Takes same arguments as
conf_mat() - Calculates classification accuracy
$$\frac{TP + TN}{TP + TN + FP + FN}$$
yardstickfunctions always return a tibble.metric- type of metric.estimate- calculated value
accuracy(leads_results,
truth = purchased,
estimate = .pred_class)
# A tibble: 1 x 3
.metric .estimator .estimate
<chr> <chr> <dbl>
1 accuracy binary 0.759
Sensitivity
In many cases accuracy is not the best metric
leads_dfdata- Classifying all as 'no' gives 64% accuracy
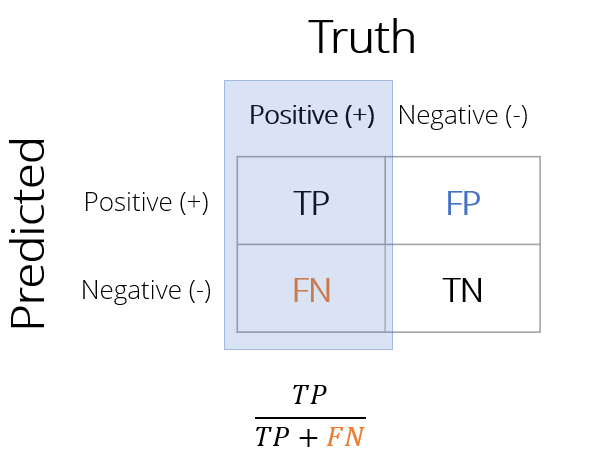
Sensitivity
Proportion of all positive cases that were correctly classified
- Of customers who did purchase, what proportion did our model predict correctly?
- Lower false negatives increase sensitivity
Calculating sensitivity
The sens() function
- Takes same arguments as
conf_mat()andaccuracy() - Returns sensitivity calculation in
.estimatecolumn
sens(leads_results,
truth = purchased,
estimate = .pred_class)
# A tibble: 1 x 3
.metric .estimator .estimate
<chr> <chr> <dbl>
1 sens binary 0.617
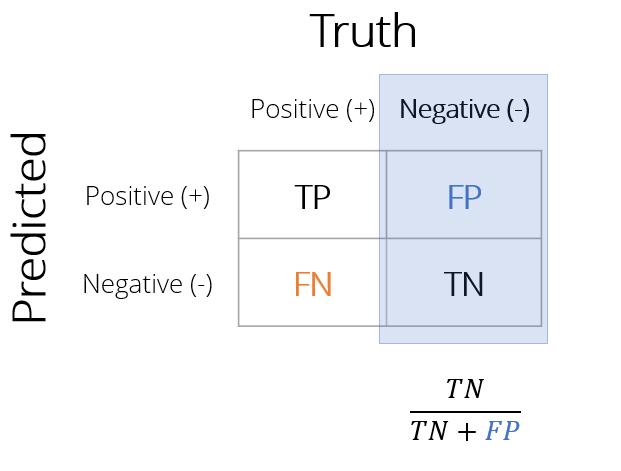
Specificity
Specificity is the proportion of all negative cases that were correctly classified
- Of customers who did not purchase, what proportion did our model predict correctly?
- Lower false positives increase specificity
1 - Specificity
- Also called the false positive rate (FPR)
- Proportion of false positives among true negatives
Calculating specificity
The spec() function
- Takes same arguments as
sens() - Returns specificity calculation in
.estimatecolumn
spec(leads_results,
truth = purchased,
estimate = .pred_class)
# A tibble: 1 x 3
.metric .estimator .estimate
<chr> <chr> <dbl>
1 spec binary 0.840
Creating a metric set
User-defined metric sets
metric_set()function- Creates user-defined metric function with selected
yardstickmetrics - Pass
yardstickmetric function names intometric_set() - Use custom function to calculate metrics
- Creates user-defined metric function with selected
custom_metrics <-
metric_set(accuracy, sens, spec)
custom_metrics(leads_results,
truth = purchased,
estimate = .pred_class)
# A tibble: 3 x 3
.metric .estimator .estimate
<chr> <chr> <dbl>
1 accuracy binary 0.759
2 sens binary 0.617
3 spec binary 0.840
Many metrics
Binary classification metrics
Wide variety of binary classification metrics
accuracy(),kap(),sens(),spec(),ppv(),npv(),mcc(),j_index(),bal_accuracy(),detection_prevalence(),precision(),recall(),f_meas()
Pass results of
conf_mat()tosummary()to calculate all
conf_mat(leads_results,

         truth = purchased,

estimate = .pred_class) %>%
summary()
# A tibble: 13 x 3
   .metric              .estimator .estimate
   <chr>                <chr>          <dbl>
 1 accuracy             binary         0.759
 2 kap                  binary         0.466
 3 sens                 binary         0.617
 4 spec                 binary         0.840
 5 ppv                  binary         0.685
 6 npv                  binary         0.795
 7 mcc                  binary         0.468
 8 j_index              binary         0.456
 9 bal_accuracy         binary         0.728
10 detection_prevalence binary         0.325
11 precision            binary         0.685
12 recall               binary         0.617
13 f_meas               binary         0.649
Let's practice!
Modeling with tidymodels in R

