Survival Analysis in Python
Shae Wang
Senior Data Scientist
A method of statistical inference
Null hypothesis $H_0$: e.g. California and Nevada residents have the same average income.
Alternative hypothesis $H_1$: e.g. California and Nevada residents have different average income.
P-value: what's the likelihood that the data would've occurred if the null hypothesis were true?
$H_0$: $S_A(t)=S_B(t)$
$H_1$: $S_A(t)\neq S_B(t)$
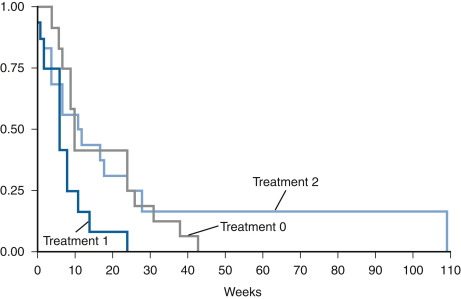
Multiple survival curves
from lifelines.statistics import logrank_test
logrank_test(durations_A, durations_B, event_observed_A, event_observed_B)
.print_summary()
.p_value
.test_statistic
Does the program change when babies start speaking?
t.head(2)
id duration observed
0 1 12 0
1 4 6 1
c.head(2)
id duration observed
0 0 11 1
1 2 14 0
lrt = logrank_test(
durations_A = t['duration'],
durations_B = c['duration'],
event_observed_A = t['observed'],
event_observed_B = c['observed'])
lrt.print_summary()
<lifelines.StatisticalResult: logrank_test>
null_distribution = chi squared
degrees_of_freedom = 1
test_name = logrank_test
test_statistic p -log2(p)
0.09 0.77 0.38
lifelines
, data must be right-censored (i.e. subject 3)pairwise_logrank_test()
or multivariate_logrank_test()
Survival Analysis in Python