Fitting the Weibull model
Survival Analysis in Python

Shae Wang
Senior Data Scientist
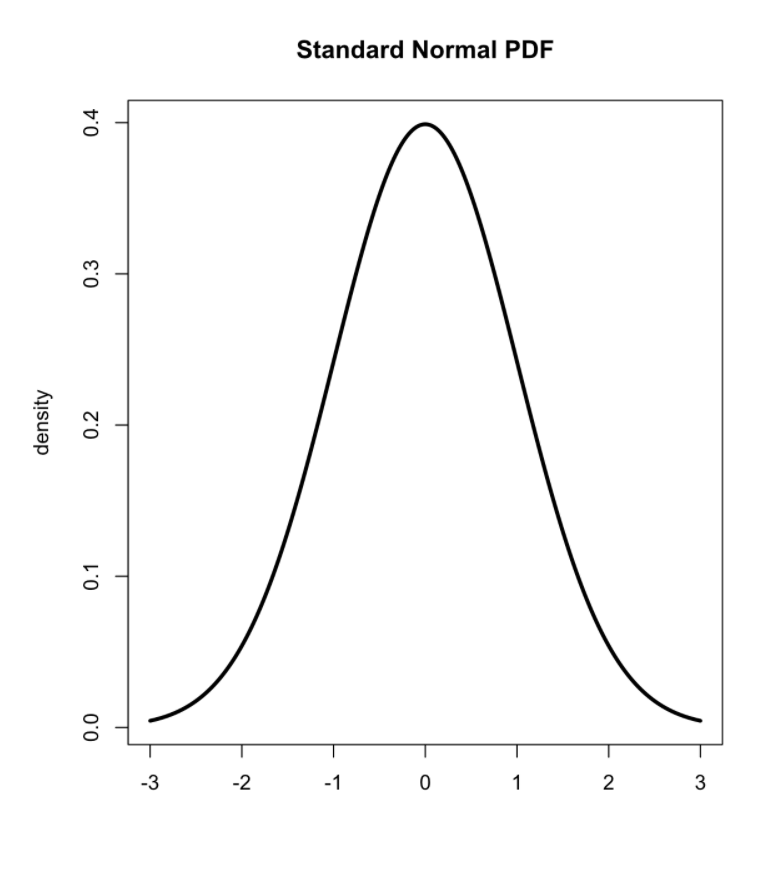
Probability distributions
A probability distribution
A mathematical function that describes the probability of different event outcomes.
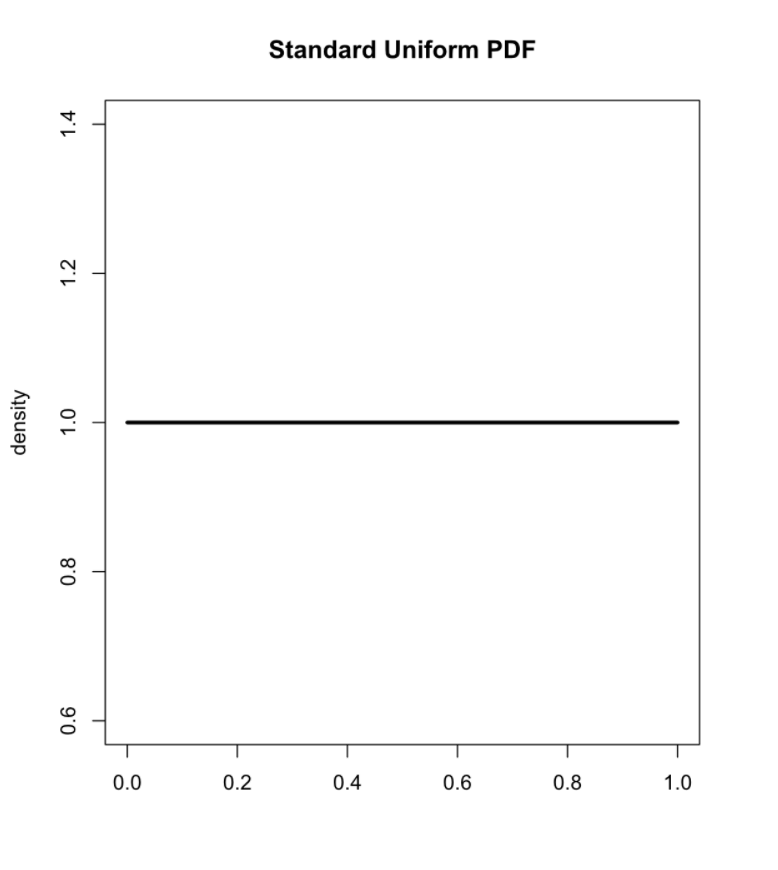
Probability distributions
A probability distribution
A mathematical function that describes the probability of different event outcomes.
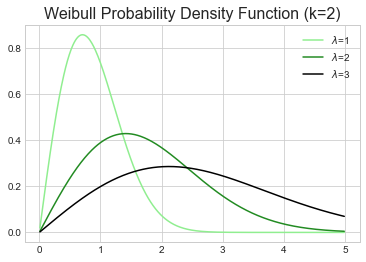
Introducing the Weibull distribution
$k$
Determines the shape
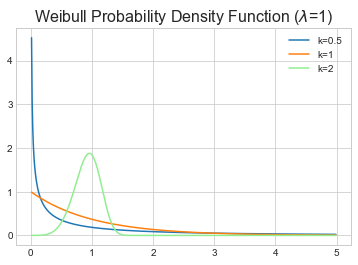
$\lambda$
Determines the scale
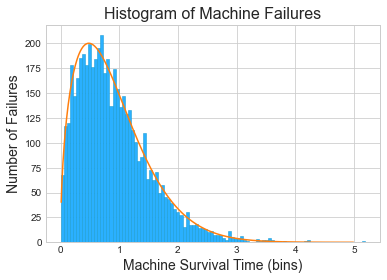
Fitting the Weibull distribution to data
A company maintains a fleet of machines that are prone to failure...

Fitting the Weibull distribution to data
A company maintains a fleet of machines that are prone to failure...
From Weibull distribution to survival function
$$f(x;\lambda,k)=\frac{k}{\lambda}\bigg(\frac{x}{\lambda}\bigg)^{k-1}e^{-(x/\lambda)^k} \quad\rightarrow\quad\qquad\qquad S(t)=e^{-(t/\lambda)^\rho}$$
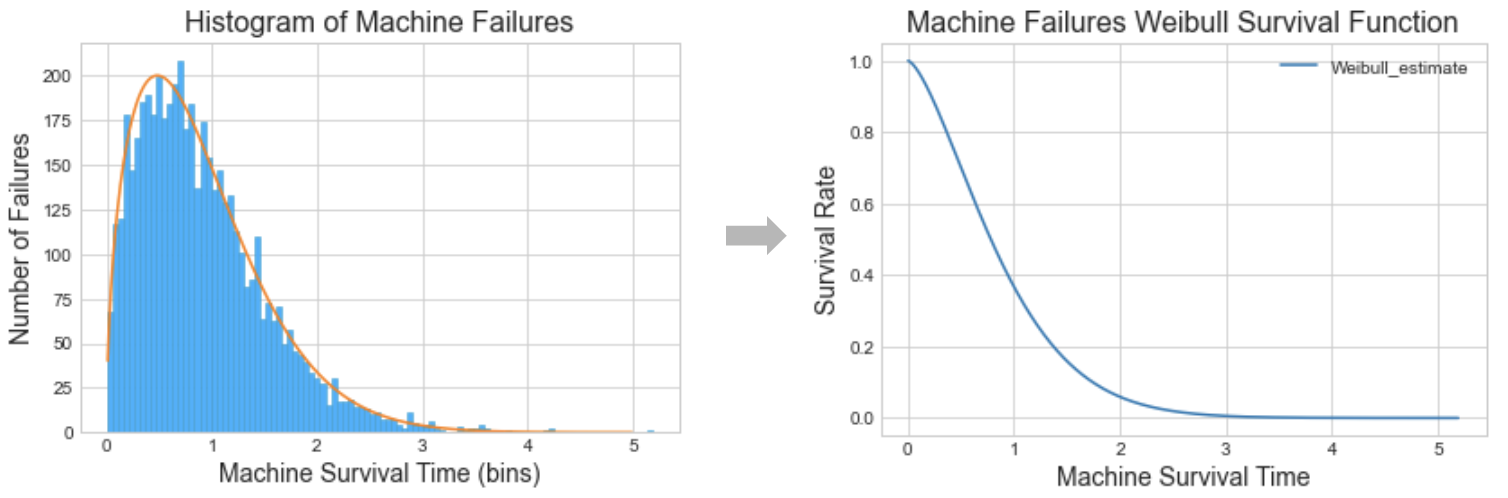
$\rho$ is same as k
Interpreting k (or $\rho$)
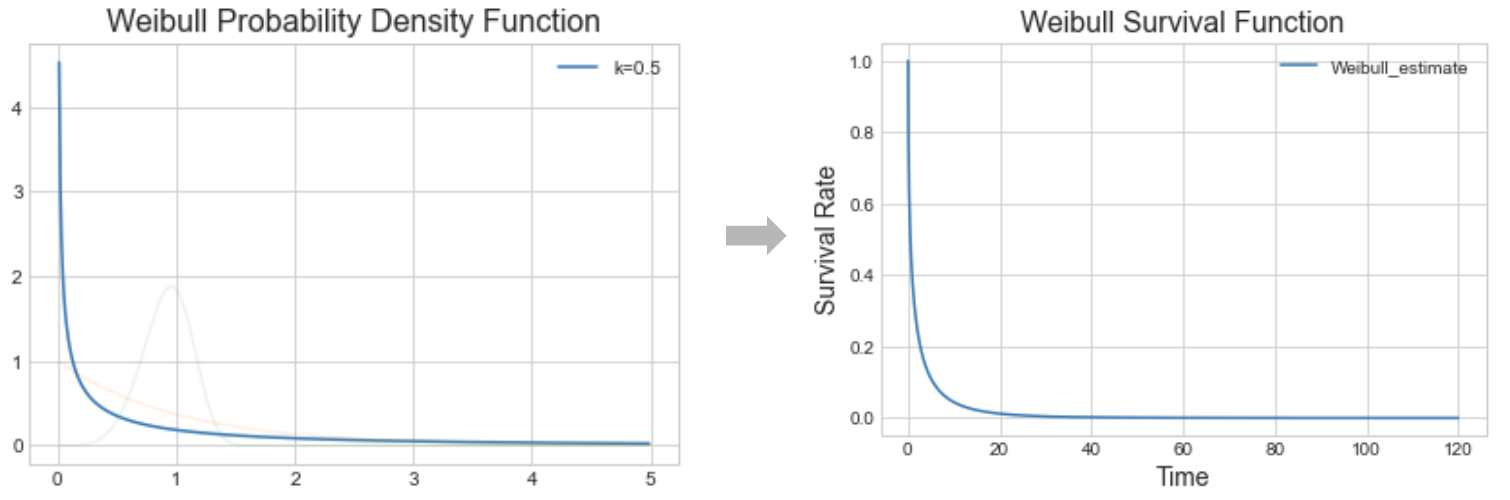
- When $k<1$, the failure/event rate decreases over time.
Interpreting k (or $\rho$)
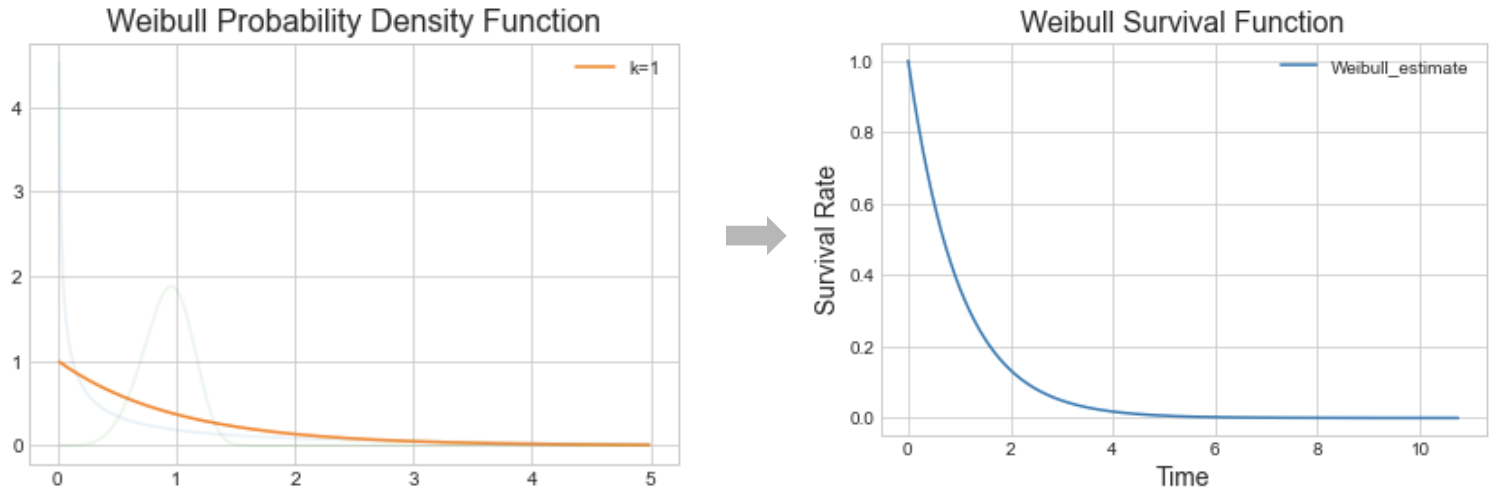
- When $k=1$, the failure/event rate is constant over time.
Interpreting k (or $\rho$)
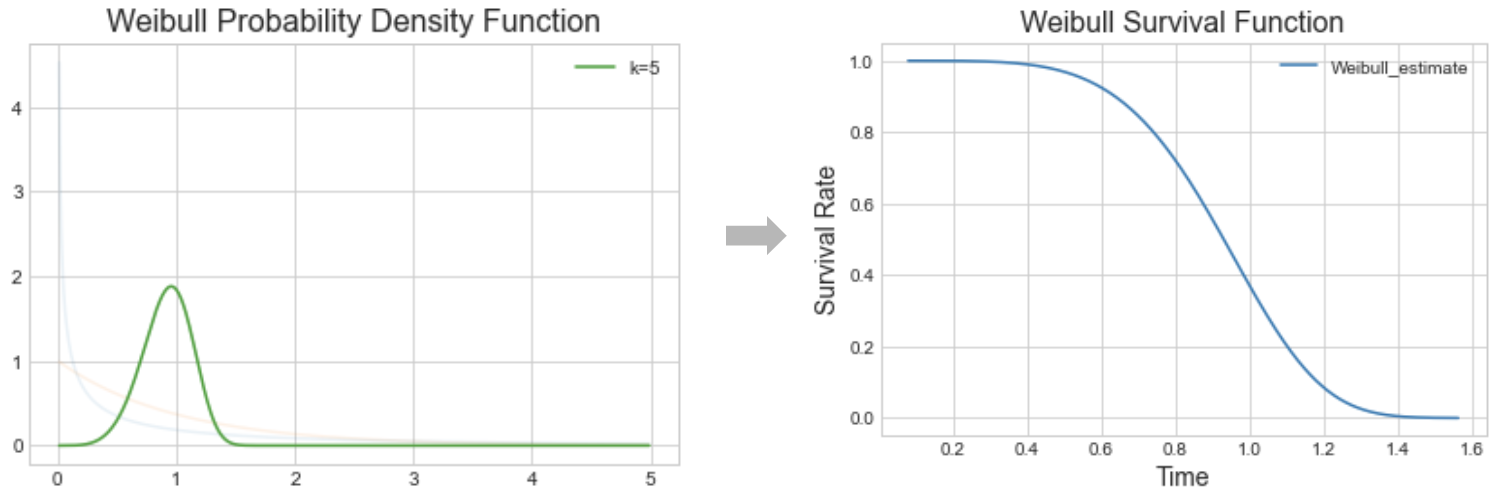
- When $k>1$, the failure/event rate increases over time.
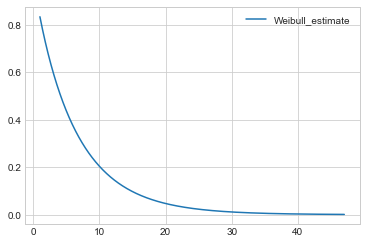
Example Weibull model
wb.survival_function_.plot()
plt.show()