Interpreting the Cox PH model
Survival Analysis in Python

Shae Wang
Senior Data Scientist
The baseline functions
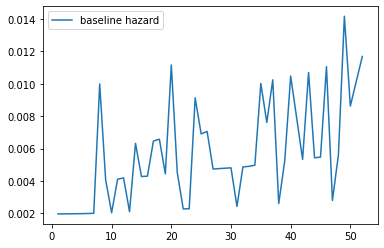
Baseline hazard function
model.baseline_hazard_.plot()
plt.show()
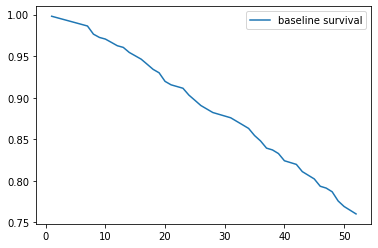
Baseline survival function
model.baseline_survival_.plot()
plt.show()
Visualize the hazard ratio
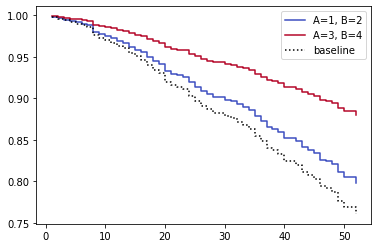
Wrong...
Visualize the hazard ratio
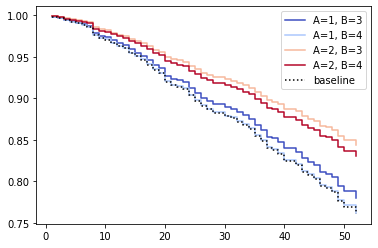
Correct!

