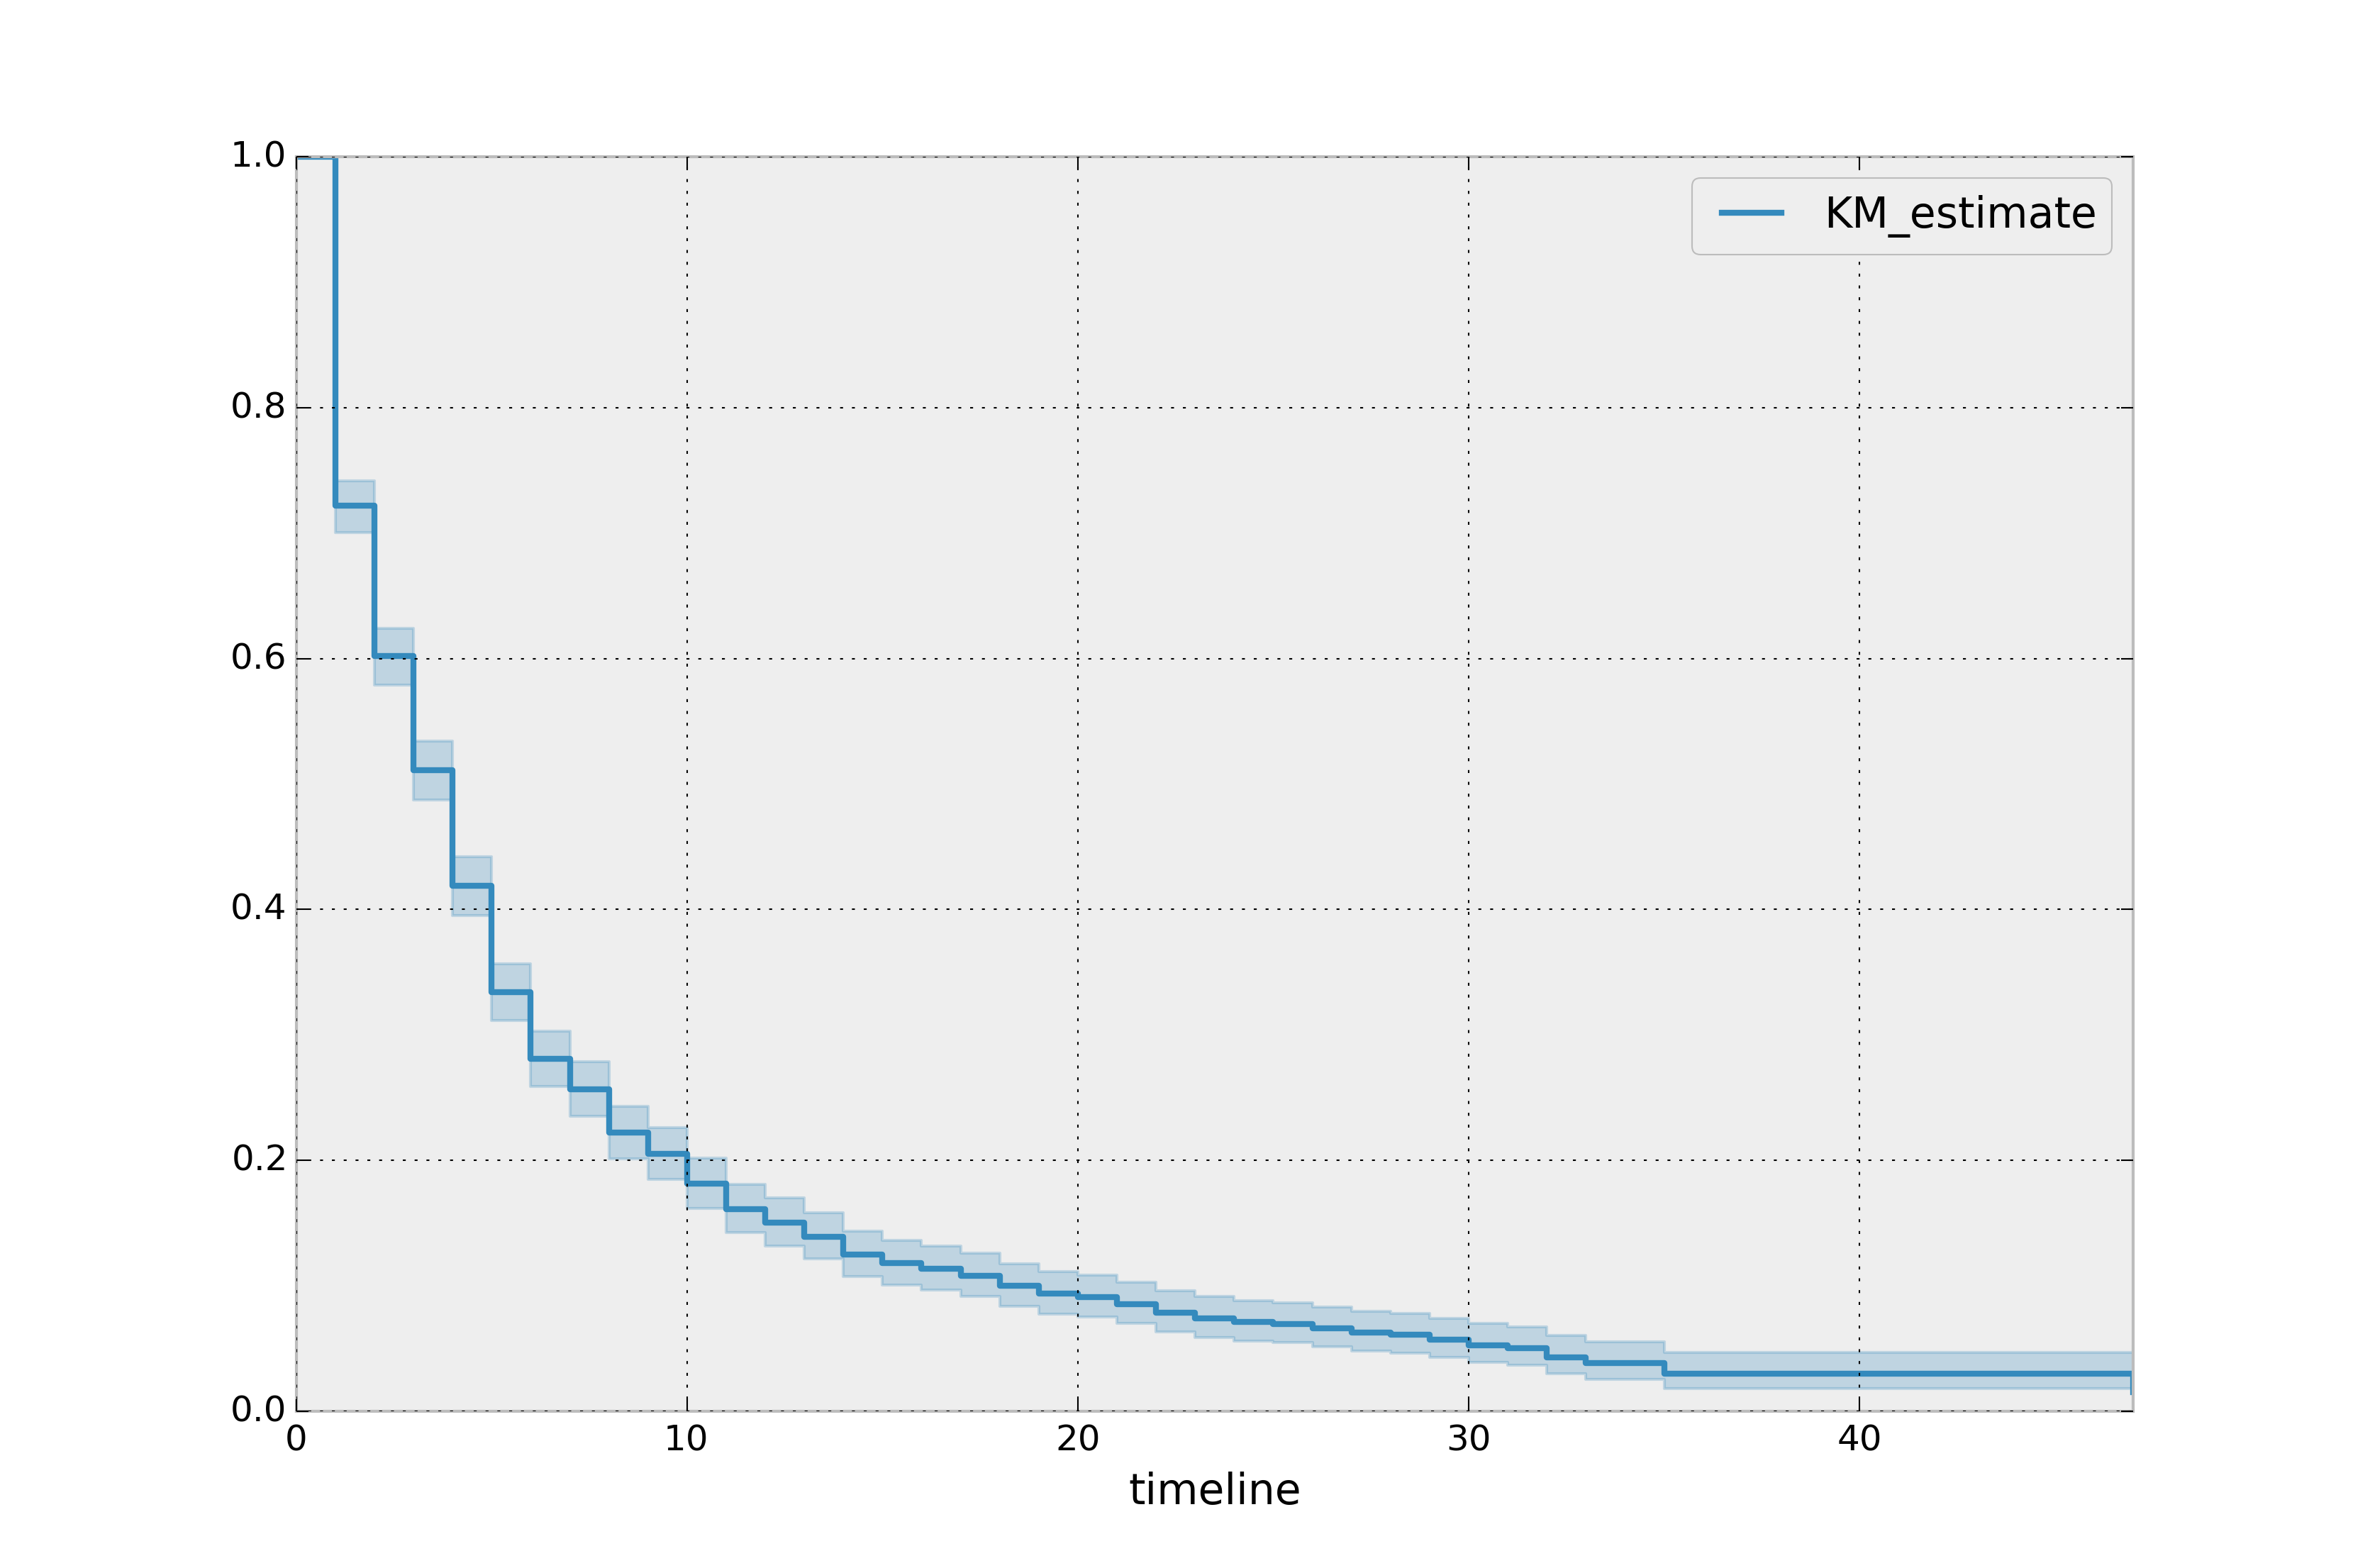
Your first survival curve!
Survival Analysis in Python

Shae Wang
Senior Data Scientist
The survival curve
$$\Large{S(t) = Pr(T>t)}$$
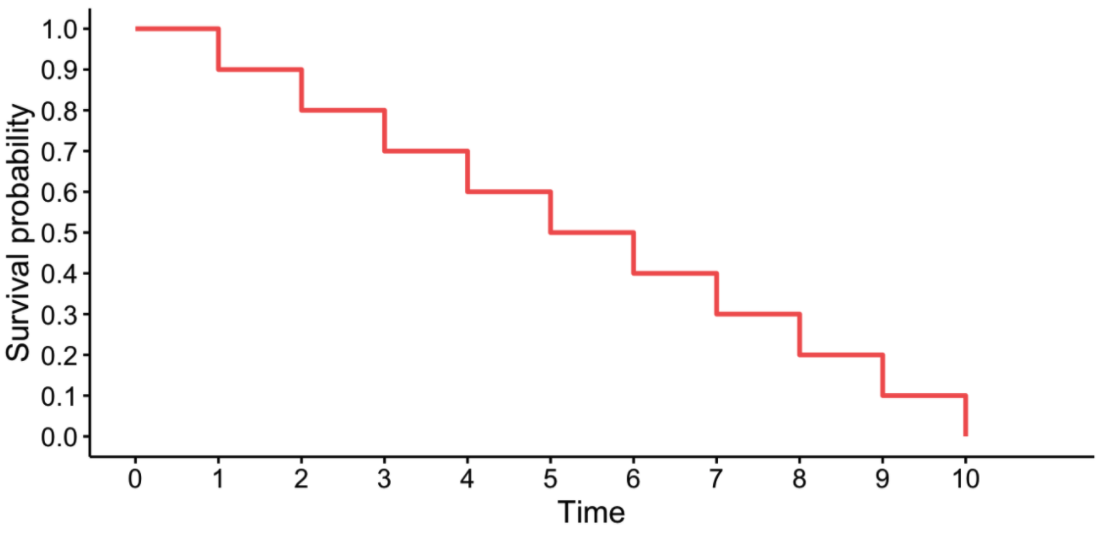
The survival curve
$$\Large{S(t) = Pr(T>t)}$$
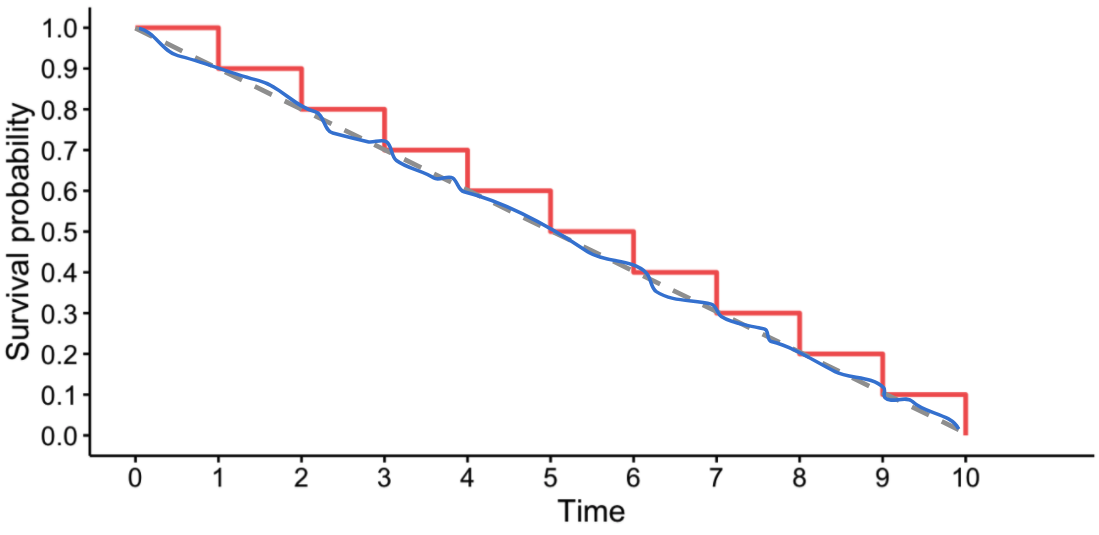
The survival curve
$$\Large{S(t) = Pr(T>t)}$$
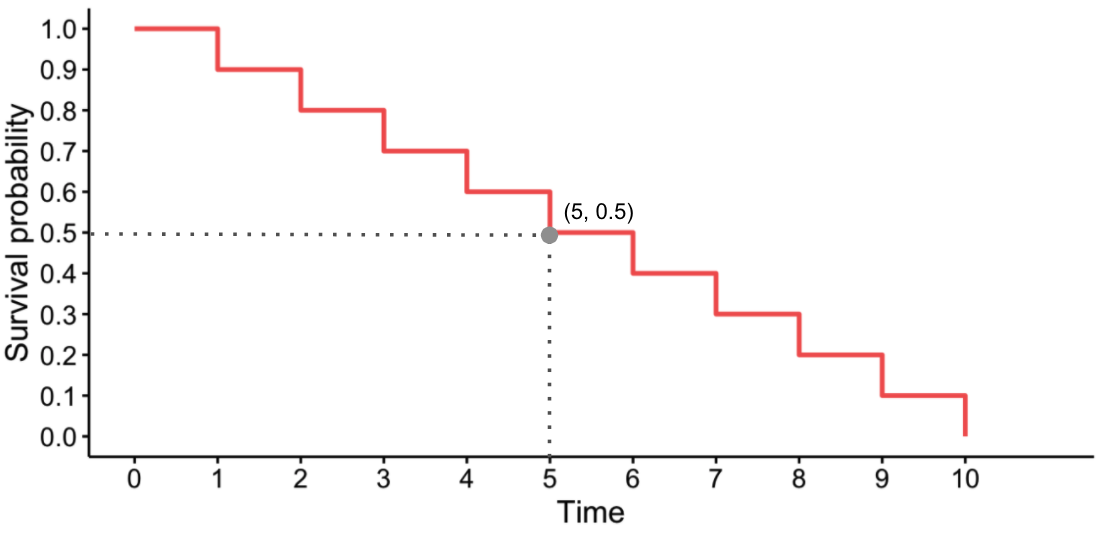
Interpreting a survival curve
Interpreting a survival curve
Non-parametric versus parametric models
Non-parametric modeling
- Survival curve is usually NOT smooth
Parametric modeling
- Survival curve is usually smooth
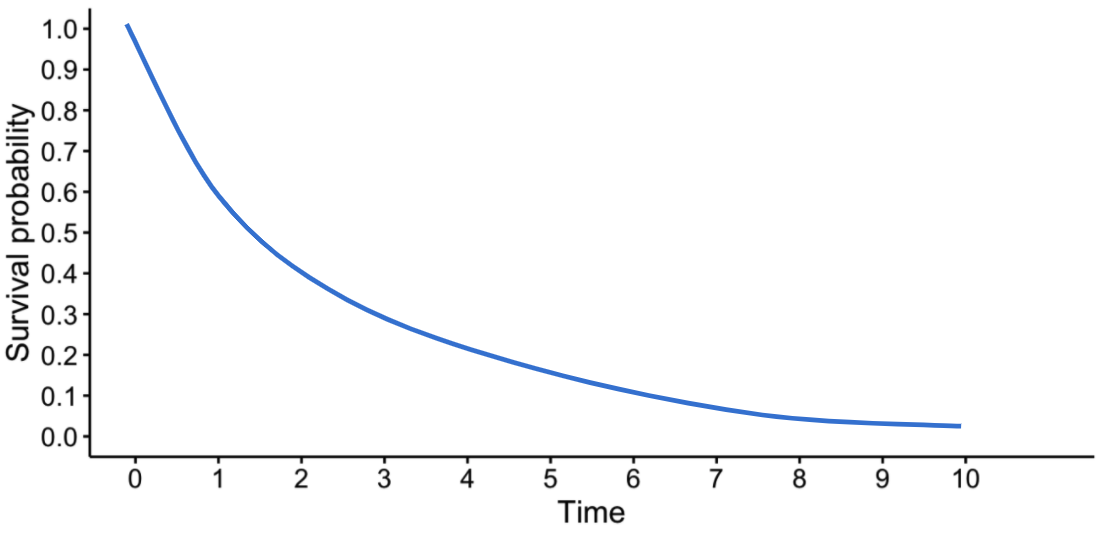
- Relies on the parametric model actually being a good description of the data
Survival curve example