Weibull model with covariates
Survival Analysis in Python

Shae Wang
Senior Data Scientist
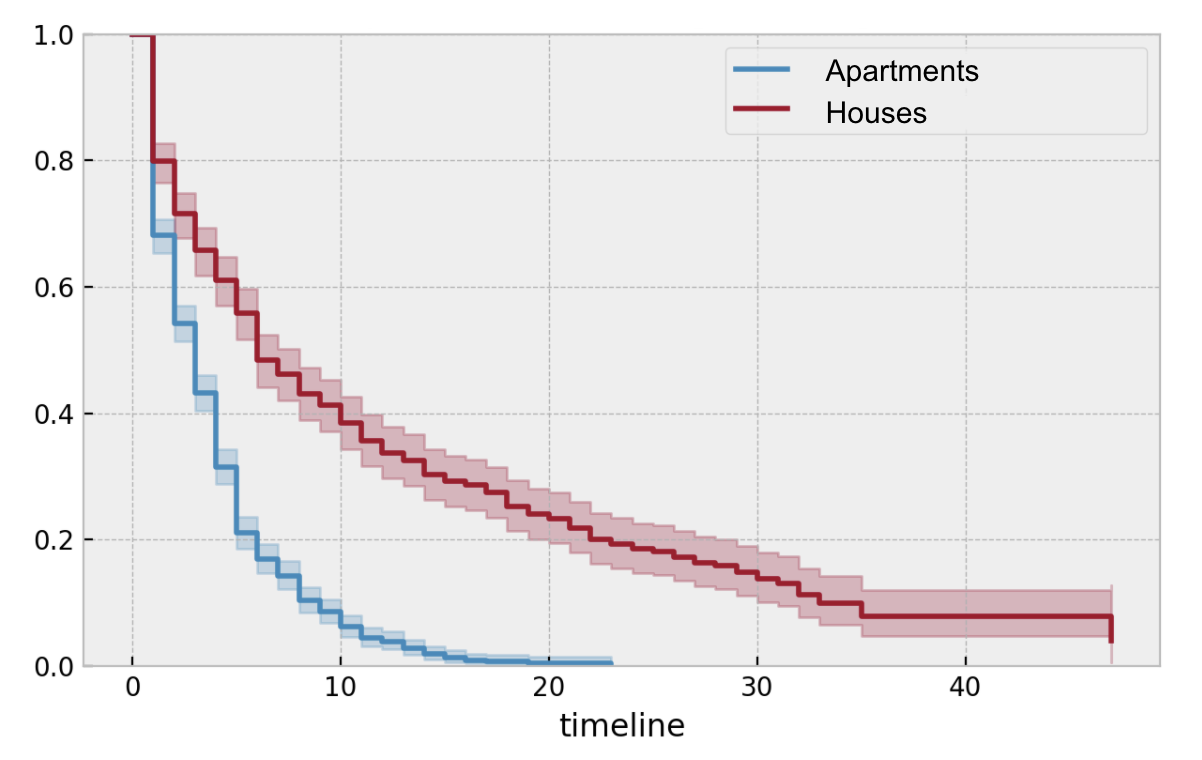
Comparing survival functions
Compare groups using the Kaplan-Meier estimator:
Compare groups using the log-rank test:
<lifelines.StatisticalResult: logrank_test>
 null_distribution = chi squared
degrees_of_freedom = 1
         test_name = logrank_test
 test_statistic    p  -log2(p)
           0.09 0.77      0.38
Q: How do we assess if/how one or multiple continuous variables affect the survival function?
Survival regression
- A method that models survival functions with covariates
- Quantifies how each covariate affects the survival function
$$Y_i=f(X_i,\beta)$$
$$Y_i: \text{durations}, X_i: \text{covariates}$$
- Example covariates: age, weight, country
The Accelerated Failure Time (AFT) model
$$\text{Population A}: S_A(t)$$
$$\text{Population B}: S_B(t)$$
$$S_A(t)=S_B(t*\lambda)$$
$S_B(t)$ is speeding up (accelerating) or slowing down (decelerating) along $S_A(t)$ by a factor of $\lambda$.
AFT models this acceleration/deceleration relationship based on model covariates.
- When a covariate changes from $a$ to $b$, time-to-event speeds up or slows down by the accelerated failure rate $\lambda$.
- Example: $S_{dog}(t)=S_{human}(t*7)$
Data for survival regression
DataFrame example: mortgage_df
| id | property_type | principal | interest | property_tax | credit_score | duration | paid_off |
|---|---|---|---|---|---|---|---|
| 1 | house | 1275 | 0.035 | 0.019 | 780 | 25 | 0 |
| 2 | apartment | 756 | 0.028 | 0.020 | 695 | 17 | 1 |
| 3 | apartment | 968 | 0.029 | 0.017 | 810 | 5 | 0 |
| ... | ... | ... | ... | ... | ... | ... | ... |
| 1000 | house | 1505 | 0.041 | 0.023 | 750 | 30 | 1 |
Combining Weibull with AFT: the Weibull AFT model
- DataFrame:
mortgage_df - Covariates:
property_typeis replaced with a dummy variable:house: 1 if "house", 0 if "apartment"
principalinterestproperty_taxcredit_score
- Import and instantiate the
WeibullAFTFitterclassfrom lifelines import WeibullAFTFitter aft = WeibullAFTFitter() - Call
.fit()to fit the estimator to the dataaft.fit(df=mortgage_df, duration_col="duration", event_col="paid_off")
Interpreting model output
print(aft.summary)
<lifelines.WeibullAFTFitter: fitted with 1808 observations, 340 censored>
                      coef  exp(coef)  se(coef)      z       p
lambda_ house         0.04       1.04      0.01   0.99    0.32
        principal    -0.03       0.97      0.22  -1.04    0.30
        interest      0.11       1.11      0.15   1.96    0.05
        property_tax  0.31       1.36      0.27   1.15    0.25
        credit_score -0.16       0.85      0.14  -2.33    0.02
        Intercept     3.99      54.06      0.41   9.52 <0.0005
rho_    Intercept     0.34       1.40      0.08   3.80 <0.0005
WeibullAFTFitter with custom formula
Using formula to handle custom model covariates:
aft.fit(df=mortgage_df,
        duration_col="duration",
        event_col="paid_off",
        formula="principal + interest * house")
Analogous to the linear model with interaction term:
$\beta_1$principal$+\beta_2$interest$+\beta_3$house$+\beta_4$interest$\cdot$house
Interpreting model output
print(aft.summary)
<lifelines.WeibullAFTFitter: fitted with 1808 observations, 340 censored>
                       coef  exp(coef)  se(coef)      z       p
lambda_ principal     -0.03       0.97      0.22  -1.04    0.30
        interest       0.11       1.11      0.15   1.96    0.05
        house          0.04       1.04      0.01   0.99    0.32
        interest:house 0.06       1.06      0.14   0.42    0.64
        Intercept      3.99      54.06      0.41   9.52 <0.0005
rho_    Intercept      0.34       1.40      0.08   3.80 <0.0005
Let's practice!
Survival Analysis in Python

