Predictions and odds
Introduction to Regression with statsmodels in Python

Maarten Van den Broeck
Content Developer at DataCamp
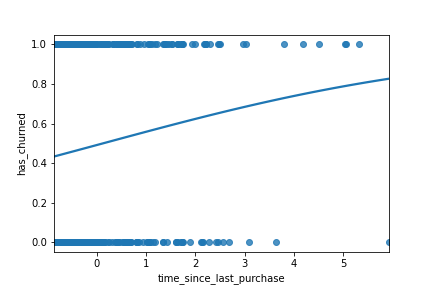
The regplot() predictions
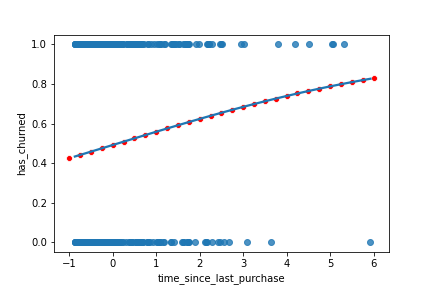
Adding point predictions
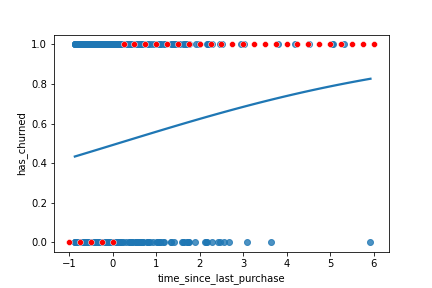
Visualizing most likely outcome
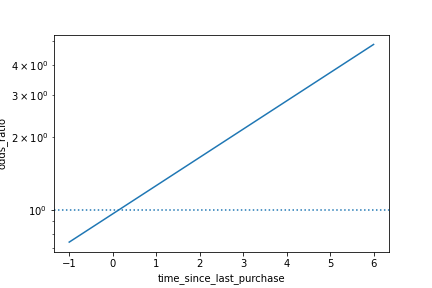
Odds
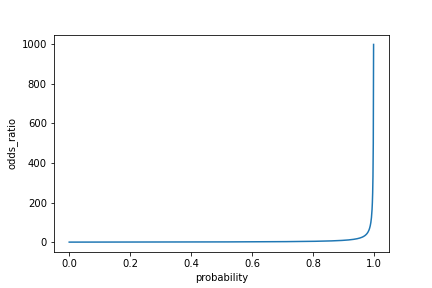
Visualizing odds
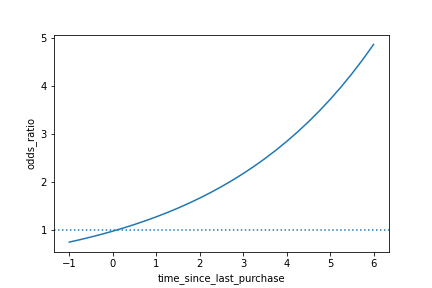
Visualizing log odds