Parallel slopes linear regression
Intermediate Regression with statsmodels in Python

Maarten Van den Broeck
Content Developer at DataCamp
The previous course
This course assumes knowledge from Introduction to Regression with statsmodels in Python
From simple regression to multiple regression
Multiple regression is a regression model with more than one explanatory variable.
More explanatory variables can give more insight and better predictions.
The course contents
Chapter 1
- "Parallel slopes" regression
Chapter 2
- Interactions
- Simpson's Paradox
Chapter 3
- More explanatory variables
- How linear regression works
Chapter 4
- Multiple logistic regression
- The logistic distribution
- How logistic regression works
The fish dataset
| mass_g | length_cm | species |
|---|---|---|
| 242.0 | 23.2 | Bream |
| 5.9 | 7.5 | Perch |
| 200.0 | 30.0 | Pike |
| 40.0 | 12.9 | Roach |
- Each row represents a fish
mass_gis the response variable- 1 numeric, 1 categorical explanatory variable
One explanatory variable at a time
from statsmodels.formula.api import ols

mdl_mass_vs_length = ols("mass_g ~ length_cm",
                         data=fish).fit()
print(mdl_mass_vs_length.params)
Intercept   -536.223947
length_cm     34.899245
dtype: float64
- 1 intercept coefficient
- 1 slope coefficient
mdl_mass_vs_species = ols("mass_g ~ species + 0",
                          data=fish).fit()

print(mdl_mass_vs_species.params)
species[Bream]    617.828571
species[Perch]    382.239286
species[Pike]     718.705882
species[Roach]    152.050000
dtype: float64
- 1 intercept coefficient for each category
Both variables at the same time
mdl_mass_vs_both = ols("mass_g ~ length_cm + species + 0",
                       data=fish).fit()
print(mdl_mass_vs_both.params)
species[Bream]    -672.241866
species[Perch]    -713.292859
species[Pike]    -1089.456053
species[Roach]    -726.777799
length_cm           42.568554
dtype: float64
- 1 slope coefficient
- 1 intercept coefficient for each category
Comparing coefficients
print(mdl_mass_vs_length.params)
Intercept   -536.223947
length_cm     34.899245
print(mdl_mass_vs_both.params)
species[Bream]    -672.241866
species[Perch]    -713.292859
species[Pike]    -1089.456053
species[Roach]    -726.777799
length_cm           42.568554
print(mdl_mass_vs_species.params)
species[Bream]    617.828571
species[Perch]    382.239286
species[Pike]     718.705882
species[Roach]    152.050000
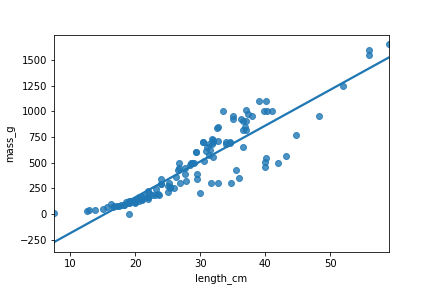
Visualization: 1 numeric explanatory variable
import matplotlib.pyplot as plt
import seaborn as sns

sns.regplot(x="length_cm",
            y="mass_g",
            data=fish,
            ci=None)

plt.show()

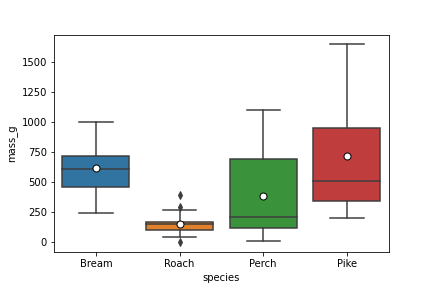
Visualization: 1 categorical explanatory variable
sns.boxplot(x="species",
            y="mass_g",
            data=fish,
            showmeans=True)

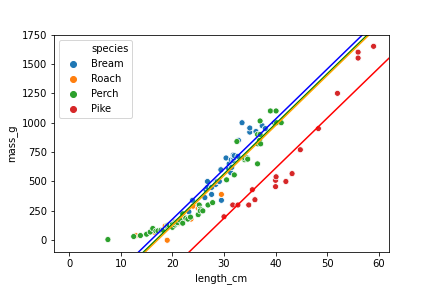
Visualization: both explanatory variables
coeffs = mdl_mass_vs_both.params
print(coeffs)
species[Bream]    -672.241866
species[Perch]    -713.292859
species[Pike]    -1089.456053
species[Roach]    -726.777799
length_cm           42.568554
ic_bream, ic_perch, ic_pike, ic_roach, sl = coeffs
sns.scatterplot(x="length_cm",
                y="mass_g",
                hue="species",
                data=fish)
plt.axline(xy1=(0, ic_bream), slope=sl, color="blue")
plt.axline(xy1=(0, ic_perch), slope=sl, color="green")
plt.axline(xy1=(0, ic_pike), slope=sl, color="red")
plt.axline(xy1=(0, ic_roach), slope=sl, color="orange")

Let's practice!
Intermediate Regression with statsmodels in Python

