Simpson's Paradox
Intermediate Regression with statsmodels in Python

Maarten Van den Broeck
Content Developer at DataCamp
A most ingenious paradox!
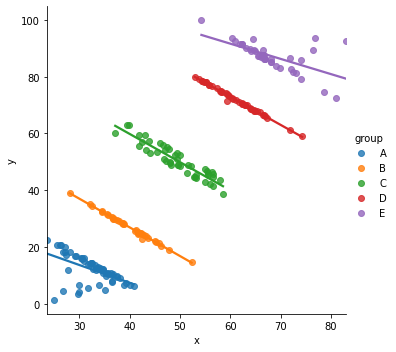
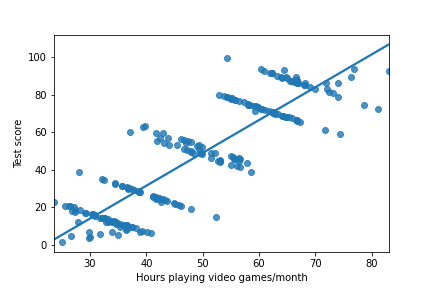
Simpson's Paradox occurs when the trend of a model on the whole dataset is very different from the trends shown by models on subsets of the dataset.
trend = slope coefficient
Synthetic Simpson data
| x | y | group |
|---|---|---|
| 62.24344 | 70.60840 | D |
| 52.33499 | 14.70577 | B |
| 56.36795 | 46.39554 | C |
| 66.80395 | 66.17487 | D |
| 66.53605 | 89.24658 | E |
| 62.38129 | 91.45260 | E |
- 5 groups of data, labeled "A" to "E"
1 https://www.rdocumentation.org/packages/datasauRus/topics/simpsons_paradox
Linear regressions
Whole dataset
mdl_whole = ols("y ~ x",
                 data=simpsons_paradox).fit()

print(mdl_whole.params)
Intercept           -38.554
x                     1.751
By group
mdl_by_group = ols("y ~ group + group:x + 0",
                   data = simpsons_paradox).fit()

print(mdl_by_group.params)
  groupA    groupB    groupC    groupD    groupE
 32.5051   67.3886   99.6333  132.3932  123.8242
groupA:x  groupB:x  groupC:x  groupD:x  groupE:x
 -0.6266   -1.0105   -0.9940   -0.9908   -0.5364
Plotting the whole dataset
sns.regplot(x="x",
            y="y",
            data=simpsons_paradox,
            ci=None)

Plotting by group
sns.lmplot(x="x",
           y="y",
           data=simpsons_paradox,
           hue="group",
           ci=None)

Reconciling the difference
Good advice
If possible, try to plot the dataset.
Common advice
You can't choose the best model in general – it depends on the dataset and the question you are trying to answer.
More good advice
Articulate a question before you start modeling.
Test score example


Infectious disease example


Reconciling the difference
- Usually (but not always) the grouped model contains more insight.
- Are you missing explanatory variables?
- Context is important.
Simpson's paradox in real datasets
- The paradox is usually less obvious.
- You may see a zero slope rather than a complete change in direction.
- It may not appear in every group.
Let's practice!
Intermediate Regression with statsmodels in Python

