Simpson's Paradox
Intermediate Regression with statsmodels in Python

Maarten Van den Broeck
Content Developer at DataCamp
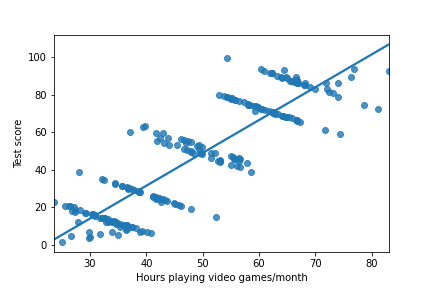
Plotting the whole dataset

Plotting by group
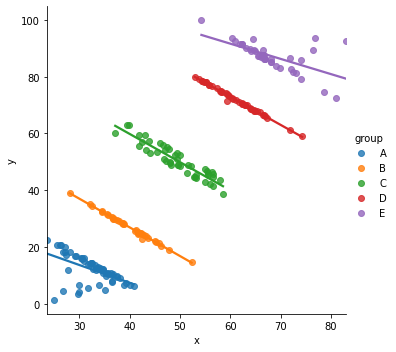
Test score example

Infectious disease example


Intermediate Regression with statsmodels in Python
Maarten Van den Broeck
Content Developer at DataCamp

