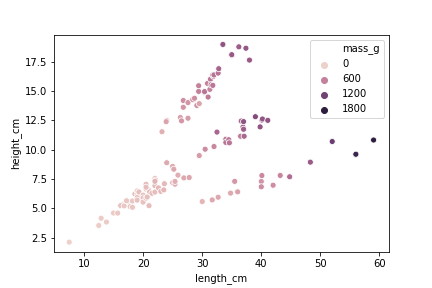
More than two explanatory variables
Intermediate Regression with statsmodels in Python

Maarten Van den Broeck
Content Developer at DataCamp
From last time
Faceting by species
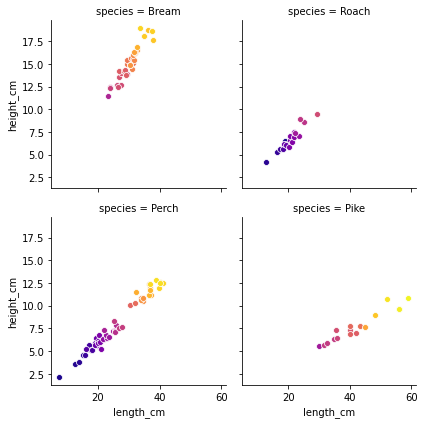
Faceting by species
Intermediate Regression with statsmodels in Python
Maarten Van den Broeck
Content Developer at DataCamp

