More than two explanatory variables
Intermediate Regression with statsmodels in Python

Maarten Van den Broeck
Content Developer at DataCamp
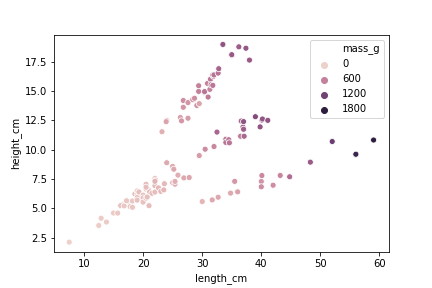
From last time
sns.scatterplot(x="length_cm",
                y="height_cm",
                data=fish,
                hue="mass_g")

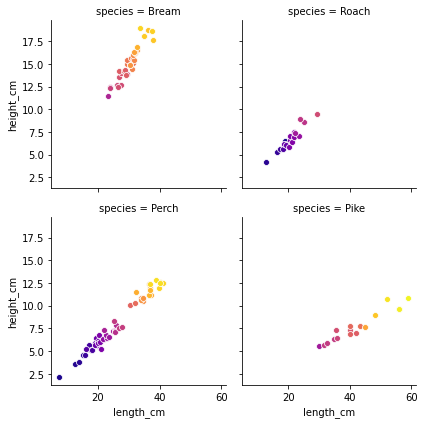
Faceting by species
grid = sns.FacetGrid(data=fish,col="species",hue="mass_g", col_wrap=2,palette="plasma")
grid.map(sns.scatterplot,
         "length_cm",
         "height_cm")
plt.show()

Faceting by species
- It's possible to use more than one categorical variable for faceting
- Beware of faceting overuse
- Plotting becomes harder with increasing number of variables

Different levels of interaction
No interactions
ols("mass_g ~ length_cm + height_cm + species + 0", data=fish).fit()
two-way interactions between pairs of variables
ols(
  "mass_g ~ length_cm + height_cm + species +
  length_cm:height_cm + length_cm:species + height_cm:species + 0", data=fish).fit()
three-way interaction between all three variables
ols(
  "mass_g ~ length_cm + height_cm + species +
  length_cm:height_cm + length_cm:species + height_cm:species + length_cm:height_cm:species + 0", data=fish).fit()
All the interactions
ols(
  "mass_g ~ length_cm + height_cm + species +
  length_cm:height_cm + length_cm:species + height_cm:species + length_cm:height_cm:species + 0",
  data=fish).fit()
same as
ols(
  "mass_g ~ length_cm * height_cm * species + 0",
  data=fish).fit()
Only two-way interactions
ols(
  "mass_g ~ length_cm + height_cm + species +
  length_cm:height_cm + length_cm:species + height_cm:species + 0",
  data=fish).fit()
same as
ols(
  "mass_g ~ (length_cm + height_cm + species) ** 2 + 0",
  data=fish).fit()
The prediction flow
mdl_mass_vs_all = ols(
  "mass_g ~ length_cm * height_cm * species + 0",
  data=fish).fit()

length_cm = np.arange(5, 61, 5)
height_cm = np.arange(2, 21, 2)
species = fish["species"].unique()

p = product(length_cm, height_cm, species)

explanatory_data = pd.DataFrame(p,
                                columns=["length_cm",
                                         "height_cm",
                                         "species"])

prediction_data = explanatory_data.assign(
  mass_g = mdl_mass_vs_all.predict(explanatory_data))

print(prediction_data)
     length_cm  height_cm species       mass_g
0            5          2   Bream  -570.656437
1            5          2   Roach    31.449145
2            5          2   Perch    43.789984
3            5          2    Pike   271.270093
4            5          4   Bream  -451.127405
..         ...        ...     ...          ...
475         60         18    Pike  2690.346384
476         60         20   Bream  1531.618475
477         60         20   Roach  2621.797668
478         60         20   Perch  3041.931709
479         60         20    Pike  2926.352397

[480 rows x 4 columns]
Let's practice!
Intermediate Regression with statsmodels in Python

