The logistic distribution
Intermediate Regression with statsmodels in Python

Maarten Van den Broeck
Content Developer at DataCamp
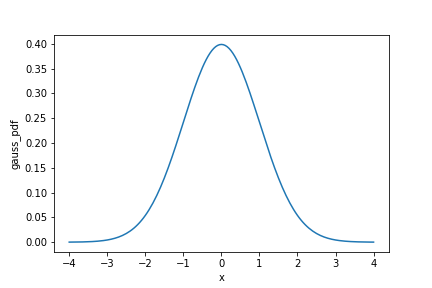
Gaussian probability density function (PDF)
Gaussian cumulative distribution function (CDF)
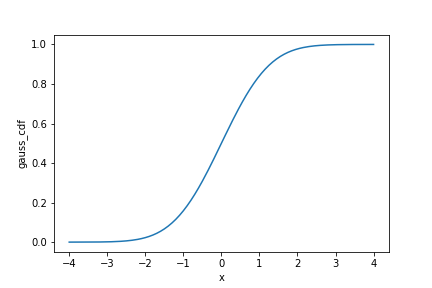
Gaussian cumulative distribution function (CDF)
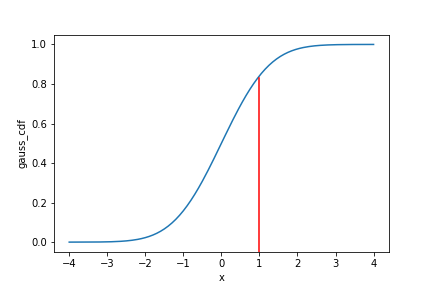
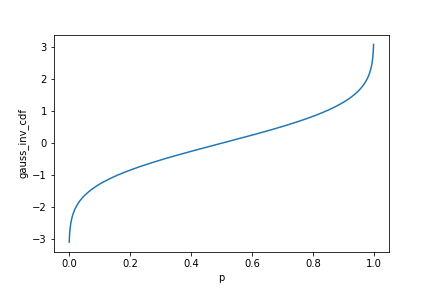
Gaussian inverse CDF
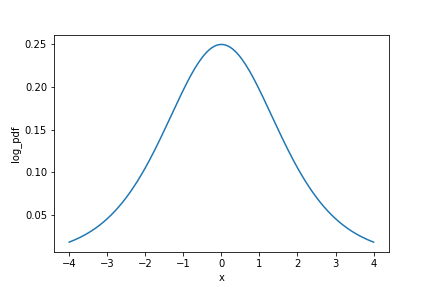
Logistic PDF